For baseball batters, On-Base Percentage (OBP) plays a role as it measures their ability to consistently get on base through hits, walks, and being hit by pitches.
It emphasizes the importance of plate discipline and rewards batters who exhibit patience.
OBP baseball is closely linked to team success as it increases the number of baserunners, ultimately leading to production.
Unlike batting average, it offers an assessment of a player’s offensive skills by considering both power and patience.
Observing my new players, I see many of them are interested in improving their stat. And I guess you crave to learn like them. I’ve shared more about the OBP meaning, its historical significance, calculation methods, and factors that influence it in this article.
What is OBP (On-Base Percentage) in Baseball?
On-Base Percentage (OBP) is a vital baseball statistic that measures how frequently a player gets on base, including through hits, walks, and being hit by a pitch. It’s often seen as a more comprehensive metric than traditional batting average because it accounts for all methods by which a batter can safely reach base—not just hits.
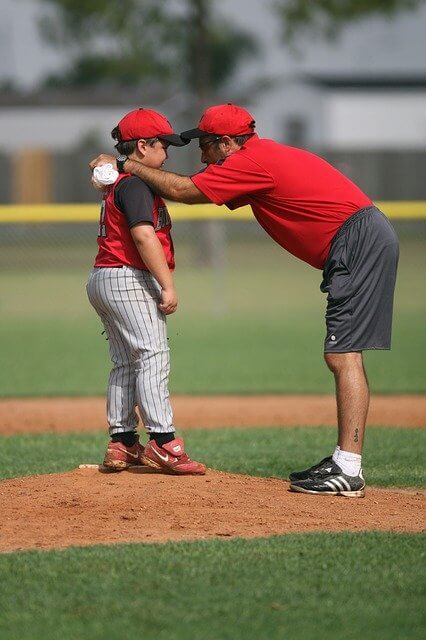
OBP plays a significant role in evaluating a player’s effectiveness at generating scoring opportunities for their team. Here is one image for get a good idea about OBP in baseball.
This stat is particularly valuable because it provides insight into how well a player manages their plate appearances, helping both teams and fans understand the player’s overall offensive contribution beyond just hitting power.
Historical Background
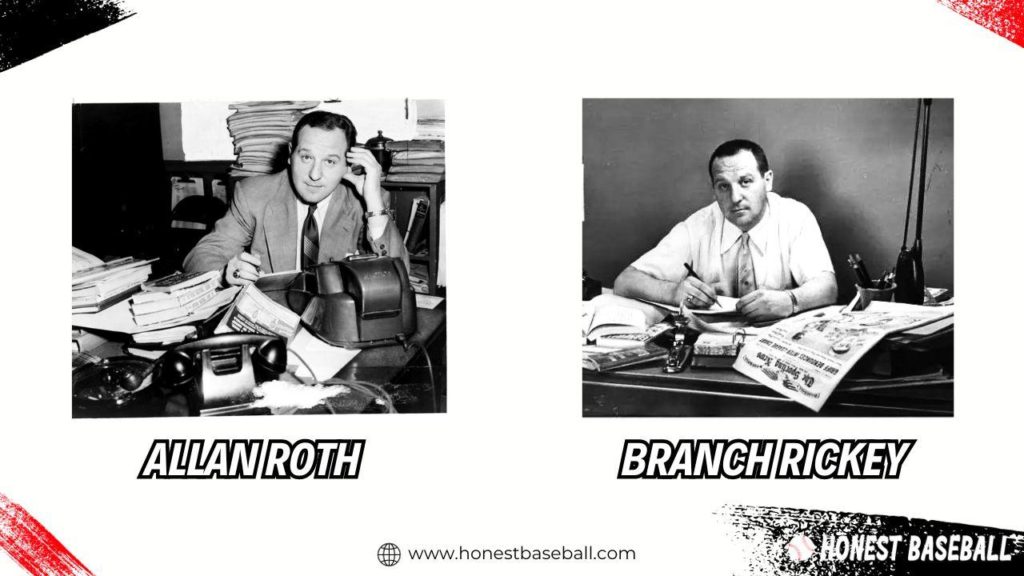
Unlike most baseball statistics, the on-base percentage has a rich history. It was first introduced in the late 1940s by Allan Roth, the statistician for the Brooklyn Dodgers, along with Dodgers general manager Branch Rickey.
The formula for OBP was featured in a 1954 Life Magazine graphic when Rickey was with the Pittsburgh Pirates.
But it wasn’t popular until 1984, when OBP became an official MLB statistic.
However, the importance of OBP was thrust into the spotlight in 2003 thanks to the book Moneyball.
The book highlighted how Oakland A’s general manager, Billy Beane, used OBP analysis to build a successful team.
How to Calculate On Base Percentage?
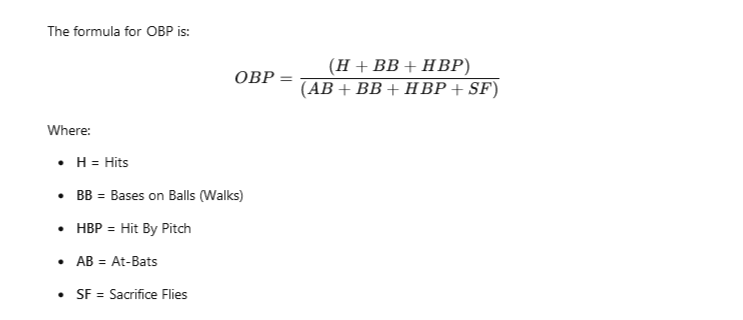
To calculate OBP in baseball, follow a simple formula that takes into account a batter’s hits, walks, and hit-by-pitches.
The OBP formula is as follows: OBP = (Hits + Walks + Hit by Pitch) / (At Bats + Walks + Hit by Pitch + Sacrifice Flies).
To figure out a player’s OBP, you take the total number of times they reached base and divide it by their at-bats.
So let’s say Johnny had 100 hits, 50 walks, and got banned 10 times last season. He had 200 at-bats. We’d calculate his OBP like this:
100 hits + 50 walks + 10 hit-by-pitches = 160 times reached safely 160 divided by 200 at-bats equals an OBP of 0.400.
Therefore, if Johnny’s OBP is 0.400, that means 40% of the time he came up to the plate, he found his way on base rather than making an out.
“A higher OBP means you’re more likely to get on and into scoring position. The higher the number, the better!”
One key point - reaching on an error doesn't count toward OBP. The batter has to reach base by his own skills for it to figure into his percentage. Same thing with the fielder's choice. The goal is to measure how good the batter is at not making outs.
4 Proven Factors Affecting On-Base Percentage in Baseball
A player’s on-base percentage depends on a bunch of different skills and circumstances. Let’s break it down:
Hitting Ability: First off, your actual hitting ability matters. If you consistently make solid contact, you’re more likely to get those base hits to boost your OBP.
Batter’s Discipline and Patience: Plate discipline is huge, too. Batters who can lay off pitches outside the zone and work walks tend to get on base more often. Patience pays off!
Batter’s Speed: Speed is another big factor. Those fast runners can leg out infield dribblers or beat out throws to first more often. Their wheels translate into a better OBP.
Pitch Selection: You also need to know your strengths as a hitter. Being able to pick out your types of pitches to attack gives you a better shot at reaching base. Capitalizing on mistakes helps your OBP for sure.
And we can’t forget the pitchers! Facing an ace like deGrom or Verlander is going to make it tougher to reach base consistently versus the back end of the rotation. The opposing staff’s skills impact your chances.
How Does a Player’s Position in the Batting Order Affect Their OBP?
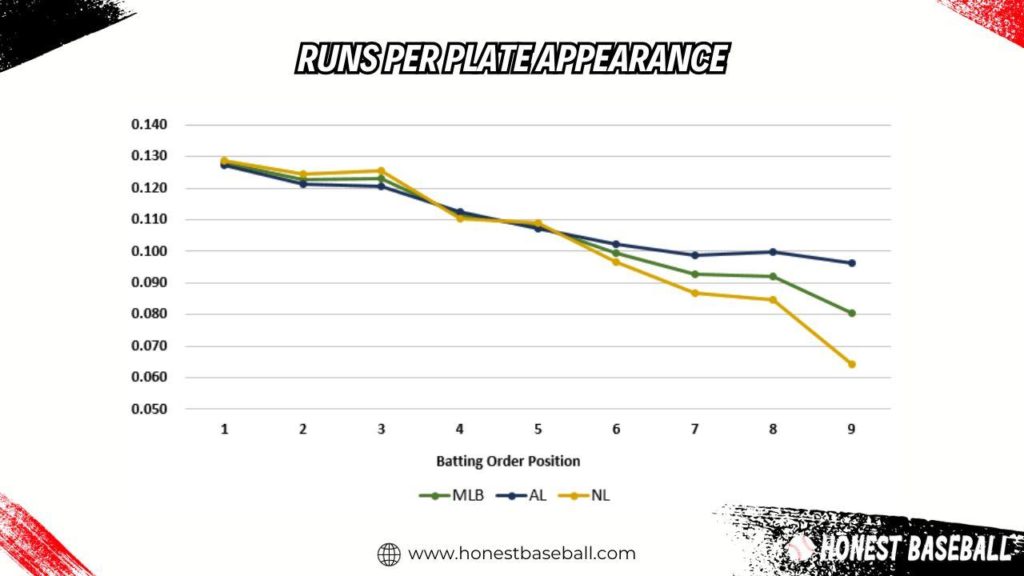
OBP can vary based on where a guy hits in the lineup since that impacts opportunities.
Leadoff hitters and #2 hole batters generally get more plate appearances over a season. That extra volume gives them a chance to boost their OBP more.
Middle-of-the-order bats like the #3, 4, and 5 hitters may see fewer pitches just because they’re such powerful run producers. Pitchers tend to be more cautious working around them.
The bottom third of the order sees the fewest PAs usually. So the #7, 8, and 9 hitters have fewer chances to get on base and lift their OBPs. They’re viewed as the easier outs.
It’s not universal, though. You can still see plenty of top hitters with elite OBPs, even while batting cleanup.
But over a full season, that extra volume for leadoff guys gives them an advantage to post a higher OBP. Getting on base is their primary role, after all.
So, in summary, lineup spots and number of opportunities can impact OBPs to some degree.
But regardless of the batting order, the best hitters are still able to post strong OBPs through their plate discipline and batting skills.
Key Differences Between OBP and Batting Average
On-base percentage (OBP) and batting average (AVG) measure different aspects of a player’s performance. Batting average only considers hits relative to at-bats, while OBP offers a more comprehensive view, accounting for hits, walks, and hit-by-pitches.
For example, a player with a high batting average but a poor walk rate might have a limited impact compared to one with a slightly lower batting average but many walks. This is because OBP reflects a player’s overall ability to avoid making outs, not just hitting successfully
Historically, teams have shifted focus from AVG to OBP for player evaluation, considering it a more accurate predictor of scoring potential. A player like Joey Votto, known for exceptional OBP due to his high walk rate, exemplifies the importance of reaching base through multiple methods.
Why OBP Matters More Than Batting Average?
The batting average just looks at hits divided by at-bats. OBP gives you a better picture by including walks, hit-by-pitches, and anything else that gets you on base safely. It shows how well a player avoids making outs.
Studies back this up – teams with a higher overall OBP score more runs. That makes sense, right? Reaching base is step one to scoring.
So a guy with a great OBP, even if his batting average is decent but not spectacular, gives his team more chances to drive him in.
“Take Barry Bonds. His career batting average was .298, which is solid but not amazing. But his OBP was a mind-blowing .444! One of the best ever.”
That’s because his incredible eye at the plate and patience led to all those walks. He found ways to get on base constantly despite not always getting hits.
So, while batting average just shows one skill – hitting safely – OBP gives you a picture of the full package.
It captures all the ways a batter can avoid outs and gives his team more scoring opportunities. The best hitters get on base any way they can!
How Does OBP Impact on Modern Baseball Strategy and Player’s Career?
The common thread is that modern MLB strategy is about maximizing opportunities to score runs. OBP is the foundation of creating those opportunities – so it has become a strategic focus.
- Increased focus on drawing walks – Teams are more willing to put batters on base via walks, understanding that OBP boosts run scoring. Getting runners on is step one.
- Strategic use of sacrifice bunts – Sac bunts are used more often now to advance runners into scoring positions. Trading an out for a runner in the scoring position increases the run probability.
- Utilizing the hit and run – The hit and run creates motion on the bases to make the defense make plays and potentially advance runners. Hitting behind the runner in motion can lead to runs.
- Roster construction prioritizing OBP – Teams value high OBP players even if they lack power. Reaching base consistently is crucial, so OBP is valued in lineup construction and trades/free agency.
7 Tips and Strategies for Improving Your OBP
The goal is to reach base more safely and frequently. Patience, mechanics, preparation, and aggressiveness on your pitches are all part of the OBP formula.
- Develop plate discipline: First, you need to work on drawing more walks and laying off bad pitches. Always try to be patient and wait for your pitch.
- Improve hitting mechanics: When patience is achieved, start analyzing your swing and make adjustments to make better contact. Consistent hard contact boosts OBP.
- Study pitchers: This is vital. Develop your skill in learning pitchers’ tendencies so you can capitalize on their mistakes. Adjust your approach based on scouting reports.
- Increase situational awareness: Understand game situations like counts and outs to optimize your at-bats. Use strategies like hit and run.
- Get feedback: Talk to coaches about improving your approach. Video analysis can provide insights to refine your swing.
- Swing at good strikes: You still have to hit! Being aggressive on strikes you can drive will lead to more bases reached.
- Consider speed training: Extra speed turns some outs into hits. It also allows you to stretch singles into doubles.
4 Advanced Metrics Related to OBP
All these Advanced metrics give us a much deeper understanding of a hitter’s true talent and value.
Using these KPIs (key performance indicators) together provides tremendous insight into the components of offense – getting on base, hitting for average, showing discipline, and hitting for power.
They help assess a hitter’s total skill set and value to their team. The days of just looking at AVG and HRs are long gone!
Here are four key advanced metrics related to OBP and how they can be used:
- Weighted On-Base Average (wOBA): Weights different outcomes like walks and extra-base hits to measure overall offensive value. Useful to compare players’ overall ability to create runs.
- Expected Weighted On-Base Average (xwOBA): Estimates expected wOBA based on exit velocity and launch angle. Helps evaluate the quality of contact and predict future performance.
- Weighted Runs (wRC+): Compares a player’s wOBA to the league average and adjusts for ballparks. Measures total offensive production compared to an average player.
- Isolated Power (ISO): Calculates extra-base power by subtracting AVG from SLG. Shows raw power skill and ability to hit for extra bases.
What Is a Good OBP in Baseball?
A solid OBP is usually around .350 or higher. But you have to look at the context – the league, the era, etc. OBPs have risen over time with changes to the game like the DH and less sacrificing.
As a general guideline for today’s game:
| OBP Level | Description | Performance Level |
| Excellent | OBP above .400 | Exceptional |
| Very Good | OBP between .350 and .399 | Outstanding |
| Good | OBP between .320 and .349 | Above Average |
| Average | OBP between .300 and .319 | Standard |
| Below Average | OBP between .280 and .299 | Subpar |
| Poor | OBP below .280 | Below Average |
| Very Poor | OBP below .250 | Very Poor |
| Abysmal | OBP below .220 | Extremely Poor |
“But you can’t look at OBP in isolation. A guy with a .340 OBP but only 10 homers isn’t necessarily better than someone with a .310 OBP and 40 bombs. You need the full picture, including AVG, SLG, HRs, etc.”
The key is that higher OBPs lead to more runners on base and more opportunities to score. For the best offensive performers, great OBP is usually part of the equation.
MLB On-Base Percentage Leaders
Having the idea about a good OBP percentage will help you also understand why the below Major League Baseball players are the on-base percentage leaders in different categories.
10 All-Time Career MLB On-Base Percentage Leaders
No one could still break the record of Ted Williams, which stood since 1958. Another interesting insight about this list is that 9 out of 10 batters are lefties. So, is it like left-handed players are dominating in hitting? Time will answer.
| Ranking | OBP Leaders | On-Base (%) | Plate Appearances | Bats |
| 1 | Ted Williams | .4817 | 9792 | L |
| 2 | Babe Ruth | .4739 | 10627 | L |
| 3 | John McGraw | .4657 | 4946 | L |
| 4 | Billy Hamilton | .4552 | 7609 | L |
| 5 | Oscar Charleston | .4489 | 3885 | L |
| 6 | Lou Gehrig | .4474 | 9665 | L |
| 7 | Barry Bonds | .4443 | 12606 | L |
| 8 | Bill Joyce | .4349 | 4163 | L |
| 9 | Jud Wilson | .4340 | 3563 | L |
| 10 | Rogers Hornsby | .4337 | 9481 | R |
10 MLB On-Base Percentage Leaders in Single Season
Early MLB seasons don’t factor into seasonal rankings, Negro League research is ongoing, rankings are limited to top performers, and special notes are made for HOFers and current players. Note –
- Pre-1876 seasons don’t count for single-season rankings.
- Negro League stats are incomplete as research continues.
- Only the top 10 finishers each season appear on the list.
| Ranking | OBP Leaders | On-Base (%) | Year | Plate Appearances | Bat |
| 1 | Barry Bonds | .6094 | 2004 | 617 | L |
| 2 | Barry Bonds | .5817 | 2002 | 612 | L |
| 3 | Josh Gibson | .5596 | 1943 | 302 | R |
| 4 | Ted Williams | .5528 | 1941 | 606 | L |
| 5 | Charlie Smith | .5515 | 1929 | 301 | L |
| 6 | John McGraw | .5475 | 1899 | 539 | L |
| 7 | Babe Ruth | .5445 | 1923 | 699 | L |
| 8 | Babe Ruth | .5319 | 1920 | 617 | L |
| 9 | Tetelo Vargas | .5294 | 1943 | 136 | R |
| 10 | Barry Bonds | .5291 | 2003 | 550 | L |
OBP Leaders and Milestones in 2024
Each season, OBP leaders emerge as key contributors to their teams, and the 2024 season is no exception. Players like Shohei Ohtani and Freddie Freeman continued to dominate with impressive OBP numbers, reflecting their consistency and versatility at the plate. Ohtani, for instance, combines power and discipline, frequently drawing walks in addition to hitting home runs, which has contributed to his high OBP
Freeman’s ability to make contact and avoid strikeouts also keeps his OBP near the top of the league. These players illustrate how modern hitters adapt to changing pitching styles by focusing not only on power but also on getting on base. OBP leaders are often found among MVP candidates because their ability to reach base consistently correlates with their teams’ success.
Teams and analysts continue to monitor OBP trends, using the data to fine-tune game plans, optimize lineups, and guide decisions during the offseason. This ongoing focus ensures that OBP remains a fundamental part of baseball’s statistical landscape and a valuable tool for assessing player performance
OPS vs OBP: Understanding Two Key Baseball Metrics
Continuing the evaluation of advanced metrics related to OBP, the comparison between OPS and OBP provides further insights into a hitter’s performance in baseball.
Here is a table comparing OPS and OBP:
| Statistic | What it Measures | Formula | Advantages | Limitations |
| OPS | Overall offensive performance | OBP + SLG | Accounts for power hitting via SLG | Can be misleading if OBP and SLG are very different |
| OBP | Ability to get on base | (H + BB + HBP) / (AB + BB + HBP + SF) | Directly measures the frequency of reaching base | Doesn’t account for power or extra-base hits |
Key Differences:
- OPS incorporates SLG to measure power hitting; OBP just focuses on reaching base
- OBP is more important for generating runs as it measures avoiding outs
- High OPS with low OBP or vice versa can be misleading
- OPS is better for overall offense; OBP is better for on-base skills, specifically
In summary, OPS and OBP both provide value but have different focuses. Using them together gives a more complete evaluation of a hitter’s abilities.
Common Misconceptions About OBP
Despite its importance, there are several misconceptions about on-base percentage (OBP) that can cloud understanding. One common myth is that OBP only applies to power hitters. In reality, players known for their speed, such as Billy Hamilton, can also achieve high OBP through their ability to draw walks and capitalize on errors, demonstrating that OBP is valuable across various player types
Another misconception is that a high OBP guarantees success for a team. While OBP is a significant factor, it doesn’t account for other crucial elements like a team’s ability to drive in runs (measured by metrics like Runs Batted In or RBI). For example, a team may have several players with high OBPs but still struggle if those players can’t convert their opportunities into runs
The Future of OBP in Baseball
As the game of baseball continues to evolve, so too does the importance of on-base percentage. Teams are increasingly adopting advanced analytics to assess player performance beyond traditional stats. This means that OBP will likely gain even more prominence in player evaluation, roster construction, and game strategy
Emerging technologies, such as machine learning and real-time data analysis, will refine how OBP is calculated and interpreted. This shift may lead to a more nuanced understanding of how different factors contribute to a player’s overall effectiveness at the plate, including pitch recognition and situational hitting
Frequently Asked Questions
What Is the Most Important Hitting Stat in Mlb?
For over a hundred years, Batting Average was an important stat to consider in baseball. However, the trend has shifted, and now managers and MLB leagues consider the on-base percentage and slugging percentage as the most important hitting stats.
How Can OBP Be Higher Than Average?
OBP captures more events that help generate offense. As a result, it’s common for players to post an OBP higher than their batting average. Here’s how:
- Walks boost OBP but not batting average
- Getting hit by pitches helps OBP, not batting average
- Hitting for power leads to a higher OBP
Essentially, a batter who excels at plate discipline and/or hitting for extra bases will likely have a higher OBP than batting average. Reaching base in any way is the goal, not just getting base hits.
The only way OBP could dip below batting average is if a player had lots of sacrifice flies and very few walks/HBP. But that is extremely rare.
What Is the Highest OPS in Baseball?
Babe Ruth achieved the highest OPS or On-base plus slugging with a tremendous score of 1.1636 OPS.
What Is an Average OBP in Mlb?
The average on-base percentage (OBP) in MLB is typically between .320-.330. In 2023, it was .322. An OBP of .340 or above is considered above average, while .400+ is exceptional.
Coach’s Advice Regarding OBP
Before wrapping it up, I need to share some advice regarding OBP baseball. As a coach, I can assure you that scoring up your OBP requires time and patience.
Without that, you’ll need to master plate discipline, hitting for contact, using the whole field, and being aggressive on the basepaths.
If you’re a single guy (not under any team), you can also benefit from self-analysis through video review, working with hitting coaches, regular batting practice, and gaining game experience.
Check out other important guides for batters –
What Does BB Mean In Baseball?
What Does TB Mean In Baseball?
What Baseball Position Should I Play?
Hello everyone. My name is Jason Butler, and I live in California, America. I was a professional AAA Minor League Baseball player. I lost my chance of playing MLB for injury issues, but I did not lose my love for baseball. I attended the coaching training program and am now working as a coach in a small school in San Diego.
I always love to share my experience and knowledge if that can help you. Play baseball, and stay fit.
