For coaches and other team players, it’s crucial to accurately assess a pitcher’s performance before and after acquiring him into a team.
But traditional statistics, like ERA (Earned Run Average), can sometimes be misleading as they are influenced by factors beyond a pitcher’s control, such as fielding and luck.
So, for such situations, the FIP Baseball metric is the most reliable for coaches, scouts, and analysts. FIP (Fielding Independent Pitching) is a metric that demonstrates what baseball pitchers are able to control like strikeouts, walks, hit-by pitches, and home runs.
By excluding the effects of fielding and luck, baseball’s FIP offers an assessment of a pitcher’s skillset.
In this informative blog post, you’ll learn more about the term, its calculation process, season leaders, and many more. Let’s head into it.
What Is FIP in Baseball?
As mentioned in the beginning, FIP, a baseball acronym for Fielding Independent Pitching, serves as a distinctive metric employed for assessing a pitcher’s performance.
While other pitching statistics mainly consider the performance of the entire team, FIP focuses solely on events that are within the pitcher’s control.
To determine a player’s FIP, analysts and coaches use factors such as strikeouts, walks, hit-by-pitches, and home runs.
“Though FIP is essential for evaluating pitchers, it has its limitations. It doesn’t consider factors like luck with batted balls or the quality of opposing hitters.”
FIP assumes that all pitchers have control over balls put into play. That’s not always the case. Hence, it’s important to use metrics and scouting observations alongside FIP for an assessment.
How to Calculate FIP Using Formula?
To calculate FIP in baseball, you need to use a specific formula. This formula involves multiplying the sum of home runs, walks, and strikeouts by specific coefficients. Let’s dive into the details of how to calculate FIP using this formula.
FIP Calculation Formula in Baseball
The formula for calculating FIP is as follows:
FIP = ((13 * HR) + (3 * (BB + HBP)) – (2 * K)) / IP + FIP_CONSTANT
Where,
- FIP, which stands for Fielding Independent Pitching, calculates a pitcher’s performance by considering factors.
- HR indicates the number of home runs allowed by the pitcher
- BB represents the number of walks given
- HBP counts the batters hit by pitches
- K represents the number of strikeouts recorded
- IP denotes the innings pitched
To standardize FIP to match the league average, an adjustment is made to a constant value known as FIP_CONSTANT.
Usually set around 3.20 this constant helps make FIP values approximately match the league ERA.
In this calculation, I multiplied home runs by 13 walks and hit by pitch incidents, by 3 and strikeouts by 2. These coefficients are used to standardize this statistic across seasons and leagues.
Normalizing Factors
The FIP formula relies on coefficients to ensure that the statistic is normalized. This is necessary because offense and pitching performance can vary across leagues and seasons. These coefficients help adjust the numbers
By incorporating these factors you can make an estimation of a pitcher’s performance based on elements within their control; home runs allowed, walks issued and strikeouts recorded.
Adjusting to League Average ERA
Once the initial result is calculated using the FIP formula it undergoes an adjustment to align with the league’s ERA (Earned Run Average). This adjustment is crucial as it ensures that FIP reflects the measures of pitching effectiveness.
The intention behind adjusting to the league’s ERA is to present a precise portrayal of a pitcher’s performance compared to their fellow players. It enables us to effectively compare pitchers from teams and eras.
Why FIP Baseball Is So Important?
FIP is a crucial statistic in baseball that provides a better understanding of how well a pitcher performs independent of their team’s defense or luck. Let’s dive into why FIP is so important and how it impacts the game.
Emphasizes Pitcher Control
The FIP holds value because it solely examines factors that pitchers have control over. It disregards runs resulting from fielding errors allowing us to gauge a pitcher’s abilities.
Provides Fair Comparison
Fielding pitching metrics enable comparisons between pitchers by eliminating the influence of defense and luck. It provides a measure of their pitching prowess irrespective of the team or season they are playing in.
Identifies Skill Level
With FIP you can accurately assess a pitcher’s skill level by scrutinizing elements within their control.
For example, if a pitcher has a FIP it signifies their ability to prevent runs effectively. On the other hand, a high FIP (also called Negative FIP) indicates room for improvement or other factors impacting their performance.
Usefulness in Player Evaluation
FIP serves as a tool in baseball as teams rely on it to evaluate how well pitchers are performing and make decisions regarding trades or acquisitions.
Informed Decision-Making for Teams
FIP plays a role in teams’ decision-making processes when evaluating pitchers. Advanced analytics such as FIP enable teams to make assessments and informed choices when signing free agents or engaging in player trades.
Here are some key reasons why teams value FIP:
- Identifying Undervalued Players: By analyzing FIP data teams can identify pitchers who may be undervalued due to lackluster traditional statistics but possess exceptional underlying skills.
- Contract Negotiations: When negotiating contracts, with pitchers teams take into account not their ERA but their FIP to determine fair compensation.
- Scouting Opposing Pitchers: When scouting opposing pitchers teams use FIP to assess their performance and create game strategies. This allows them to rely on performance, rather than just traditional statistics.
Example: Clayton Kershaw
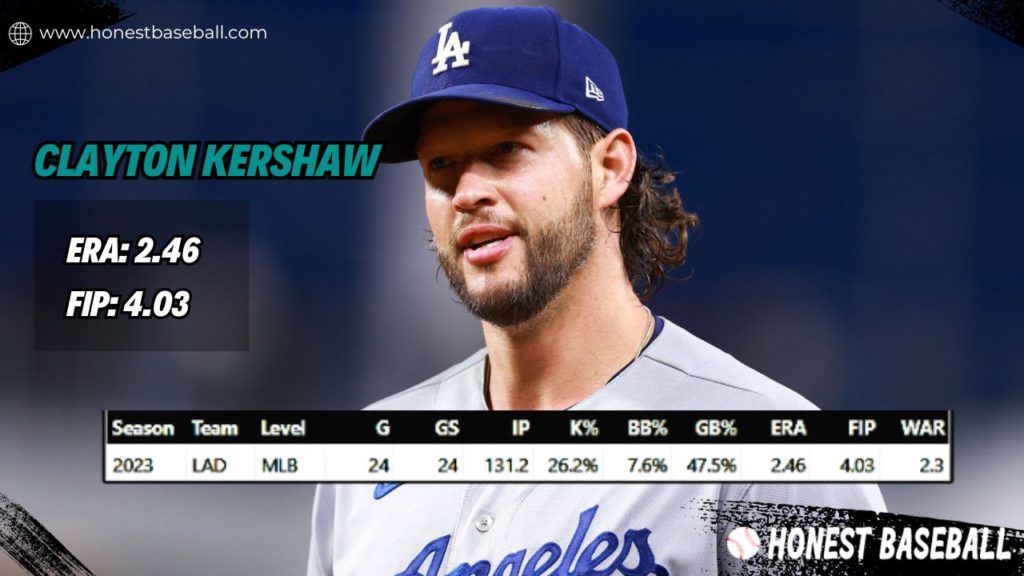
Let’s consider the case of Clayton Kershaw, a pitcher, in Major League Baseball. Throughout his career, Kershaw has consistently showcased his skills on the field as evidenced by his ERA (2.46 in the 2023 regular season)
However, when I examined his FIP (4.03 for the Los Angeles Dodgers) it revealed that he has been more exceptional than what his ERA alone indicates.
This suggests that Kershaw’s success isn’t merely attributed to luck or strong defense but rather a testament to his pitching abilities.
By taking into account FIP in conjunction with statistics, like ERA teams can make informed decisions regarding a player’s performance and overall value.
Can FIP Be Used for All Types of Pitchers?
As a baseball coach, I won’t say FIP can be used to evaluate all types of pitchers. There are different types of pitchers in baseball. Let’s see for which it’ll work and for which you require additional metric analysis:
Starting Pitchers: FIP works fine for starting pitchers as key control outcomes such as strikeouts, walks, home runs, and hit batters are part of their skill.
Relief Pitchers: They are primarily used in short or high-leverage situations. So, FIP may not fully demonstrate its value.
Groundball Pitchers: These pitchers usually have lower home run rates due to inducing ground balls. So, while you can find FIP relatable to the ground ball pitchers, it still won’t provide complete data.
Knuckleball Pitchers and Specialists: Submarine-style or knuckleball pitchers aren’t suitable for FIP assessment. The reason is pretty obvious as they feature unconventional pitching styles, which cause different batted ball profiles.
I suggest using other advanced metrics like SIERA (Skill-Interactive Earned Run Average) or traditional stats like ERA for such pitchers.
Drawbacks of FIP
Though you can evaluate most pitchers’ performance with this KPI, the Fielding, it does have its downsides too.
Batted Ball Outcomes Ignored
FIP has a limitation in that it doesn’t account for the outcomes of batted balls, such, as ground balls or fly balls that fall between fielders.
In terms of FIP treats all batted balls that aren’t strikeouts as having the same result. This oversimplification can be problematic because not all non-strikeout batted balls have the impact.
For instance, a hit ground ball is more likely to result in an out compared to a hit line drive. However, FIP fails to acknowledge these variations in outcomes.
Equal Impact of Home Runs
Another drawback of FIP is its assumption that all home runs have an effect on a pitcher’s performance regardless of when they happen during the game.
While it’s reasonable to consider home runs as part of a pitcher’s performance it may not be fair to give them weightage.
For example, surrendering a home run in the inning when your team has already scored five runs mightn’t have as significant consequences on the game compared to giving up the same solo home run, in a tied game during the ninth inning.
However, since FIP only considers home runs and disregards their context within the game situation it fails to capture this subtlety.
Oversimplification and Neglected Aspects
Critics argue that the FIP metric oversimplifies the evaluation of a pitcher’s skit, by neglecting aspects such as sequencing and situational pitching.
Pitchers who consistently excel in high-pressure situations or perform well with runners in scoring positions may not receive recognition when relying solely on FIP.
Furthermore, pitchers who have control and consistently induce contact even if they don’t rack up strikeouts might be undervalued under the FIP metric.
This is because FIP places emphasis on a pitcher’s ability to induce ground balls or pop-ups which can be equally effective in preventing runs.
While FIP does offer insights into a pitcher’s underlying skills and performance of fielding it’s crucial to acknowledge its limitations.
It doesn’t consider batted ball outcomes, assumes all home runs have an impact, and oversimplifies pitching performance, by disregarding sequencing and situational factors.
What Is a Good FIP in Baseball?
A good FIP is that the pitcher has performed well in terms of preventing runs and limiting the number of base runners. In general, a good FIP in baseball is typically around 3.00 or lower.
Lower values suggest performance as it implies that there are instances of walks, hits, and home runs allowed while also recording more strikeouts.
To understand why these factors matter, let’s break them down:
- Walks: When pitchers limit the number of walks they provide opportunities for the opposing team to score runs. This demonstrates their ability to control their pitches and effectively locate them within the strike zone.
- Hits: Restricting hits means that batters find it challenging to make contact against the type of pitches thrown by the pitcher. The more difficult it is for hitters to make contact the less likely they are to reach base.
- Home Runs: Allowing fewer home runs indicates that pitchers excel at keeping the ball inside the ballpark. Home runs can swiftly impact a game by adding runs, with one swing.
- Strikeouts: Generating strikeouts reflects a pitcher’s capability to overpower hitters with their pitching skills. By inducing swings and misses or getting batters called out on strikes pitchers can effectively neutralize threats without relying on their defense.
However, it’s worth noting that what is considered a “good” FIP can vary based on the performance of pitchers, in the league and the specific era they play in.
The level of output in a league can influence what’s deemed an exceptional FIP. For instance, during periods when offense’s generally higher, it may be more difficult for pitchers to achieve FIP values.
To provide some context let’s examine the data;
- In the 2020 season of Major League Baseball the average FIP, among all pitchers, was 4.50.
- During the steroid era” of the 1990s and early 2000s when performance-enhancing drugs led to inflated offensive statistics, pitchers who maintained FIP values below 4.00 were regarded as exceptional performers.
xFIP vs FIP in Baseball
xFIP (Expected Fielding Independent Pitching) and FIP (Fielding Independent Pitching) are two metrics commonly employed in baseball to assess how well a pitcher performs. Although they share similarities there exist variations between the two measurements.
| Aspect | FIP | xFIP |
| Adjusts for Home Run Rates | Uses actual home runs allowed | Replaces actual HRs with estimates based on fly ball rates |
| Calculation Difference | Actual HRs used in the calculation | Estimates HRs based on fly ball rates with a league-average HR/FB rate |
| Retroactive vs Predictive | Reflects past performance | Provides a more predictive measure of future performance |
| Control Over HR Rate | Assumes some control over the HR rate | Assumes less control over HR rate, normalizes using league-average |
| Interpretation | Scaled to resemble ERA for past performance | Scaled to resemble ERA for future performance, better predictor of future performance |
ERA vs. FIP in Baseball
ERA (Earned Run Average) and FIP (Fielding Independent Pitching) are two stats that baseball relies on to assess how well pitchers perform.
Although they both give us a glimpse, into a pitcher’s effectiveness they take approaches. Now get into the distinctions between ERA and FIP and why many believe that FIP is a measure of a pitcher’s true skill.
| Aspect | ERA (Earned Run Average) | FIP (Fielding Independent Pitching) |
| Definition | Measures earned runs per nine innings | Calculates a pitcher’s performance based on home runs, walks, hit batters, and strikeouts |
| Components Included | Includes all runs due to hits, walks, errors, and defensive miscues | Considers only home runs, walks, hit batters, and strikeouts |
| Control Over Defense | Influenced by team defense and luck | Isolates a pitcher’s performance from defense and luck |
| Interpretation | A lower ERA indicates better performance, but it may not reflect a pitcher’s true skill | Lower FIP suggests better underlying skill and is often more predictive of future performance |
| Use in Analysis | Often used to evaluate past performance | Commonly used for assessing a pitcher’s true skill level and predicting future performance |
| Sensitivity to Fielding Quality | Sensitive to fielding quality and luck | Insensitive to fielding quality and focuses on what the pitcher can control |
| Context | Reflects actual runs allowed in games | Focuses on a pitcher’s core skills independent of external factors |
National League FIP Baseball Leaders
In the last 23 years of National League performance, the best FIP scorer is Corbin Burnes. His 1.63 in the 2021 season is the lowest FIP in the league. Check out the full list.
| Year | National League | FIP |
| 2023 | Spencer Strider | 2.85 |
| 2022 | Carlos Rodón | 2.25 |
| 2021 | Corbin Burnes | 1.63 |
| 2020 | Yu Darvish | 2.23 |
| 2019 | Max Scherzer | 2.45 |
| 2018 | Jacob deGrom | 1.98 |
| 2017 | Stephen Strasburg | 2.72 |
| 2016 | Noah Syndergaard | 2.29 |
| 2015 | Clayton Kershaw | 1.99 |
| 2014 | Clayton Kershaw | 1.81 |
| 2013 | Matt Harvey | 2.01 |
| 2012 | Gio Gonzalez | 2.82 |
| 2011 | Roy Halladay | 2.20 |
| 2010 | Josh Johnson | 2.41 |
| 2009 | Tim Lincecum | 2.34 |
| 2008 | Tim Lincecum | 2.62 |
| 2007 | Jake Peavy | 2.84 |
| 2006 | Brandon Webb | 3.18 |
| 2005 | Roger Clemens | 2.87 |
| 2004 | Randy Johnson | 2.30 |
| 2003 | Mark Prior | 2.47 |
| 2002 | Curt Schilling | 2.40 |
| 2001 | Randy Johnson | 2.13 |
| 2000 | Randy Johnson | 2.53 |
American League FIP Leaders
American League FIP stats show a big jump compared to the National League. Anyway, in this league, the FIP leader is Shane Bieber with 2.07 in the 2020 season.
| Year | American League | FIP |
| 2023 | Sonny Gray | 2.83 |
| 2022 | Kevin Gausman | 2.38 |
| 2021 | Nathan Eovaldi | 2.79 |
| 2020 | Shane Bieber | 2.07 |
| 2019 | Gerrit Cole | 2.64 |
| 2018 | Trevor Bauer | 2.44 |
| 2017 | Chris Sale | 2.45 |
| 2016 | Corey Kluber | 3.26 |
| 2015 | Chris Sale | 2.73 |
| 2014 | Corey Kluber | 2.35 |
| 2013 | Aníbal Sánchez | 2.39 |
| 2012 | Félix Hernández | 2.84 |
| 2011 | Brandon McCarthy | 2.86 |
| 2010 | Cliff Lee | 2.58 |
| 2009 | Zack Greinke | 2.33 |
| 2008 | Cliff Lee | 2.83 |
| 2007 | Josh Beckett | 3.08 |
| 2006 | Johan Santana | 3.04 |
| 2005 | Johan Santana | 2.80 |
| 2004 | Johan Santana | 2.92 |
| 2003 | Pedro Martinez | 2.21 |
| 2002 | Pedro Martinez | 2.24 |
| 2001 | Mike Mussina | 2.92 |
| 2000 | Pedro Martinez | 2.17 |
Source: Yearly League Leaders & Records for FIP Baseball
Frequently Asked Questions
Is ERA or FIP more reliable for evaluating pitchers?
While ERA provides a measure of a pitcher’s earned runs, FIP focuses on their performance by excluding factors outside their control. Therefore, FIP is generally considered more reliable for evaluating pitchers’ true abilities.
Can FIP predict future pitching performance?
FIP (Fielding Independent Pitching) is frequently utilized as a tool for making predictions in baseball analytics.
Pitchers who consistently maintain FIPs are more likely to continue performing in the future making it an invaluable metric for forecasting their future performance.
Who are some pitchers with historically low FIPs?
Going back to history, the lowest Fielding Independent Pitching (FIP) was 2.018 recorded by Ed Walsh over his 14-year career. The score is followed by Rube Waddell (2.033) and Satchel Paige (2.188) chronologically.
Considering single season lowest FIPs, Walter Johnson with 1.38 (1910) ranked first and Pedro Martinez with 1.39 (1999) ranked second.
Wrapping Up
As you’ve got the essential understanding and insights of FIP baseball, I believe, you won’t make any mistake while acquiring a new pitcher in the team.
Just follow the calculation methods while keeping the drawbacks in mind to determine each pitcher’s performance. This will make the selection process much more efficient and errorless.
Check out more about baseball statistics and scores:
What Does RHP Mean in Baseball
What Is A Pitching Out In Baseball (Learn From Coach)
What Is A Breaking Ball? [a Complete Discussion & Top 10 Breaking Ball Players]
Hello everyone. My name is Jason Butler, and I live in California, America. I was a professional AAA Minor League Baseball player. I lost my chance of playing MLB for injury issues, but I did not lose my love for baseball. I attended the coaching training program and am now working as a coach in a small school in San Diego.
I always love to share my experience and knowledge if that can help you. Play baseball, and stay fit.