The main job of the pitchers is to prevent the batters from taking runs. That is why ERA is an important statistic for pitchers. ERA means Earned Run Average.
According to MLB, ERA is the most used statistic to measure the performance of a pitcher. The abbreviation of ERA is Earned Run Average.
So, what is ERA in baseball? Let’s explore things thoroughly.
What Is ERA In Baseball?
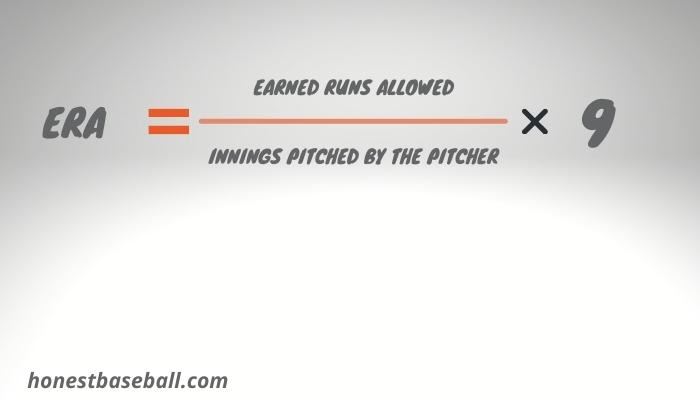
ERA stands for Earned Run Average, which measures how many earned runs a pitcher allows per nine innings.
This is an important stat in baseball. It gives a clear indicator of skill since nine innings is the standard length of a game.
A lower ERA means the opposing team earns fewer runs and shows that they are good at defense. This makes it easier to judge the overall performance of a pitcher.
Calculation of ERA with Examples
Calculating ERA is a simple process. Here’s a step-by-step guide:
- Determine the number of earned runs a pitcher has allowed. Earned runs are runs for which the pitcher is held responsible, excluding those that result from errors.
- Identify the total number of innings that the pitcher has pitched.
- Divide the total earned runs by the total innings pitched. This will give you a number that represents the earned run average per inning.
- Finally, multiply that number by 9 (since a standard game is 9 innings), and you’ve got your pitcher’s ERA!
Here is the formula
ERA = ( Total Earned Runs Allowed / Total Innings Pitched )×9
Let’s take a practical example to illustrate the calculation of ERA:
- Assume that a pitcher has allowed 7 earned runs over the course of 25 innings. We can calculate the ERA as follows:
- Take the number of earned runs (7).
- Divide this by the total number of innings pitched (25). This results in 0.28, which is the earned run average per inning.
- Multiply this number by 9 (0.28 x 9). The resulting ERA is 2.52.
This indicates that, on average, the pitcher allows approximately 2.52 runs for every nine innings they pitch. This is a fairly good ERA, suggesting that the pitcher performs well at preventing the opposing team from scoring.

What is a Good/Bad ERA?
Understanding what constitutes a good or bad ERA can depend on several factors, including the era of baseball, the pitcher’s role, and the specific league in which the player is competing.
However, in general terms, the following guidelines can provide a basic range.
Good ERA
- Sublime: An ERA under 2.00 is considered sublime, reflecting outstanding pitching performance. These numbers are rare and usually seen among the league’s elite pitchers.
- Excellent: An ERA between 2.00 and 3.00 is seen as excellent. Pitchers who consistently achieve this range are typically among the top performers in the league.
- Above Average: An ERA between 3.00 and 4.00 is generally viewed as above average. While not top-tier, pitchers with ERAs in this range are still effective and valuable to their teams.
Bad ERA
- Below Average: An ERA between 4.00 and 5.00 is seen as below average. Pitchers with ERAs in this range may struggle with consistency and allow too many earned runs.
- Poor: An ERA between 5.00 and 6.00 is generally considered poor. These pitchers often have difficulty preventing runs and may risk being demoted to the minor leagues or moved to a different role.
- Very Poor: An ERA over 6.00 is viewed as very poor. Pitchers with ERAs in this range are typically ineffective at the major league level and may face removal from the pitching rotation.
Starting Pitchers vs. Relievers: ERA Considerations
You know there are several types of pitchers in baseball.
Starting pitchers often face a more significant challenge, as they are expected to pitch several innings in a row and cycle through the opposing team’s lineup multiple times.
This prolonged exposure can result in a higher ERA compared to relievers, who typically pitch for a shorter period and face fewer batters.
Relievers, however, despite having potentially lower ERAs, operate under different pressures.
They are often brought into high-stress situations, with runners on base, in late-game scenarios, and with the outcome of the game hanging in the balance.
While their ERA might be lower, it doesn’t mean their job is easier.
What are the Limitations of ERA as a statistic?
While ERA serves as a valuable statistic in assessing a pitcher’s performance, it does come with its share of limitations.
Defensive Dependence: ERA is influenced by the defense’s performance behind the pitcher. A weak defense can lead to unearned runs that don’t count toward the ERA but still affect the game’s outcome.
Therefore, ERA may not accurately reflect a pitcher’s standalone performance.
High Variance: ERA can be highly variable from year to year, even for the same pitcher.
Factors like luck, health, and small changes in performance can cause significant ERA fluctuations, making it less reliable for predicting future performance.
Inability to Account for Context: ERA does not account for situational context, such as the score, inning, or base runners’ position.
These factors can significantly impact a pitcher’s approach and effectiveness, yet they’re not reflected in the ERA.
Doesn’t Reflect All Outcomes: ERA only considers earned runs and innings pitched, ignoring other important outcomes like strikeouts, walks, and home runs.
These outcomes can provide additional insights into a pitcher’s skill set and their likelihood of future success.
History Of ERA
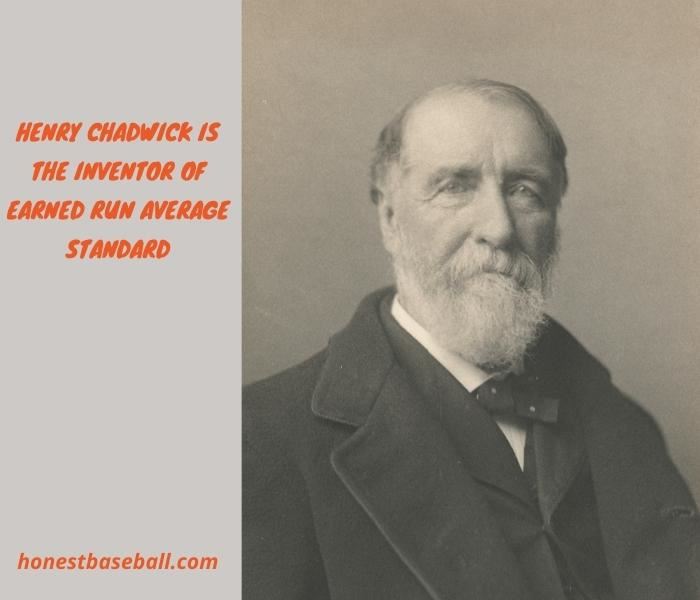
In the history of baseball, American sportswriter and baseball statistician Henry Chadwick is the inventor of the ERA statistics for the pitchers. It is because only winning and losing could not be able to evaluate a pitcher’s performance properly.
In the late 1800s, he came up with the concept of the ERA statistic. Despite the fact that the actual year is uncertain. In the first of the 1900, pitchers were able to be considered to be evaluated on their given runs.
Relief pitchers, on the other hand, began to become increasingly widespread around the turn of the century. In addition, James Otis and Charley Hall designated themselves as experts in relief throwing.
Consequently, the single win-loss statistic was insufficient for evaluating the performance of the pitchers on the field.
The National League, on the other hand, was the first to employ the Earned Run Average (ERA) method to assess pitchers in 1912. Later, the American League accepted the evaluating method and has been using the method since then.
Analyzing ERA Trends over Different Eras in Baseball
Dead-Ball Era
In this era, pitchers such as Walter Johnson were dominant. Johnson, who played from 1907 to 1927, had an exceptional career ERA of 2.17.
This era was characterized by low-scoring games and a scarcity of home runs. Hence, lower ERAs were more common among pitchers.
Live-Ball Era
With the advent of the Live-Ball Era, we saw players like Babe Ruth change the game with their hitting prowess.
As a result, ERAs increased due to the surge in home runs.
For instance, Lefty Grove, a dominant pitcher who played from 1925 to 1941, had a career ERA of 3.06 – higher than Johnson’s in the Dead-Ball Era but still impressive given the conditions of the time.
Steroid Era
The Steroid Era saw an offensive explosion, with home runs skyrocketing.
Consequently, ERAs went up. Pedro Martinez, one of the era’s best pitchers, had an ERA of 2.93.
Despite the higher-scoring environment, Martinez’s ERA stands out as remarkably low, reflecting his exceptional skill in a challenging period for pitchers.
Analytics Era
In the current Analytics Era, the use of detailed data analytics has helped pitchers optimize their performance and reduce their ERAs.
For example, Clayton Kershaw, one of the most dominant pitchers in the modern game, boasts an impressive career ERA of 2.43 as of the end of the 2021 season.
These trends show how changes in gameplay, rules, and strategies impact ERA, underscoring the importance of considering the context when comparing ERAs across different eras in baseball.
It is essential to remember that the ERA is not just a statistic but a reflection of the game’s evolving landscape.
Why Is A Low ERA Better Than A High ERA?
So, already, you should know that a lower ERA is always good and reflects the better performance of a pitcher than a higher ERA.
So, how could the lower ERA help a pitcher in several ways? These could be as follows.
- ERA only calculates the runs allowed by the pitchers. Not of error or passed ball runs. So, it is easy to evaluate the exact performance of a pitcher who is only responsible for earned runs given.
- A lower ERA gives a big chance of winning the match.
The All-Time Best With Great ERA
Dutch Leonard established the record for the lowest ERA in a single season in 1914 with a mark of 0.96. And he had a 19-5 win-loss record in 242.2 innings thrown.
On the other side, the all-time lowest ERA for a single season was established by a pitcher who threw at least 300 innings and had an ERA of 1.12. Bob Gibson composed the music for it in 1968.
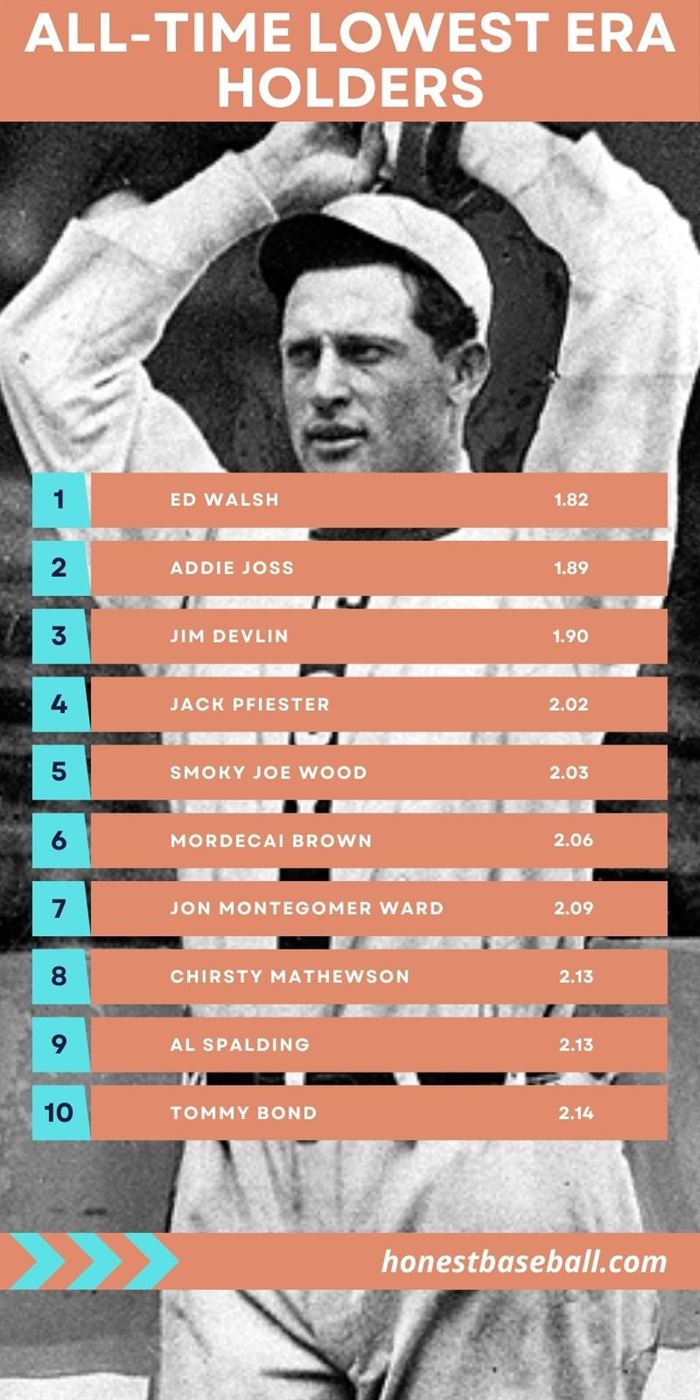
Ed Walsh is the lowest ERA holder in baseball history. He played baseball from 1904 to 1917. His ERA was 1.82, which is an all-time top.
However, I am giving the top 10 all-time lowest ERA holders below. The following image shows the list of the all-time lowest ERA holders.
What is Adjusted Earned Run Average, or ERA+?
ERA+, or Adjusted Earned Run Average, is an advanced baseball metric that adjusts a pitcher’s ERA according to the ballpark’s run-scoring environment and the league average.
The ERA+ is normalized across different ballparks and eras, making it an effective tool for comparing pitcher performance across different time periods and teams.
An ERA+ of 100 is defined as the league average, and every point above 100 represents a percentage point better than the league average.
For example, an ERA+ of 125 means that the pitcher’s ERA was 25% better than the league average. Likewise, an ERA+ of 90 indicates that the pitcher’s ERA was 10% worse than the league average.
This normalization allows for a more nuanced understanding and comparison of a pitcher’s effectiveness, taking into account the context of the game’s ever-changing dynamics.
Frequently Asked Questions
What Happens When The Pitcher Leaves The Game With A Runner Or Two In Scoring Position?
It is possible for base runners to progress to the next base when any pitcher leaves a baseball game by maintaining them at their current base.
This will be regarded as a base run, and the pitcher will be penalized accordingly. This will be added to the pitcher’s Earned Run Average (ERA) in order to compute the ERA.
What is the difference between earned and unearned runs?
An earned run is a run for which the pitcher is held accountable, while an unearned run is a run that results from a defensive error or passed ball.
What factors can influence a pitcher’s ERA?
Several factors can influence a pitcher’s ERA, including the quality of the opposing team’s hitters, the defense behind the pitcher, the ballpark in which they pitch, and the pitcher’s own skill level and health.
Is It Possible To Have An Era Of Nil?
This is just not achievable practically. However, when you take the mound for the first time, your Earned Run Average (ERA) will be 0.
However, in practice, this is not achievable due to the fact that more than 90% of runs scored are earned runs. Unearned runs are very unusual occurrences. In this regard, it is impossible to finish a pitching career with an Earned Run Average of zero.
What’s a competitive ERA for college and high school baseball?
According to research on college scouts’ evaluation of pitchers, the ERA (Earned Run Average) is one factor they consider. Here’s a rough guideline for evaluating pitchers based on their ERA:
- An ERA of 2.00 or lower is typically seen as Division I talent.
- An ERA between 2.01 and 3.00 is often considered Division II talent.
- An ERA ranging from 2.50 to 3.50 is commonly associated with Division III talent.
- A pitcher with an ERA below 4.00 may be considered Junior College talent.
What is the highest possible ERA?
Wrapping up
There are many confusing terms in baseball, FPS, DFA, WHIP, and many more. If you are a baseball lover, you must want to know all of those.
ERA is the best way to evaluate a pitcher’s performance and his pitching career. It also helps to evaluate his effectiveness and his worth.
It shows how many runs they give up in every nine innings. But, only the win-lose statistics cannot properly evaluate a pitcher’s performance. Because, during a loss, a pitcher might perform his best.
Hello everyone. My name is Jason Butler, and I live in California, America. I was a professional AAA Minor League Baseball player. I lost my chance of playing MLB for injury issues, but I did not lose my love for baseball. I attended the coaching training program and am now working as a coach in a small school in San Diego.
I always love to share my experience and knowledge if that can help you. Play baseball, and stay fit.
