Last Updated on March 4, 2026
Have you ever wondered how you were doing at the plate? This must have crossed your mind at least once in your life if you are a batter. Batting is a crucial part of the baseball game.
Therefore, study and analysis are essential. Major League Baseball’s obsession with numbers goes back decades. Statistics like batting average, runs batted in (or RBI), hits, total bases, runs, and many more have become standard fare when talking about baseball and its leagues.
However, as baseball has developed, the statistics have become more comprehensive. Batting performance is measured using an OPS stat.
For math geeks, baseball could be the best sport to play. OPS, for instance, is fascinating because it borrows formulae from different branches of statistics.
OPS, or on-base plus slugging, is a simple measure of a player’s worth to his club. Let us dissect what baseball OPS is and how they are evaluated!
The Honest Hitter’s Power Index: Calculate Your True OPS
Batting Average is a 1990s stat. In 2026, coaches only care about one thing: OPS (On-Base Plus Slugging). Are you a bench player or an elite power threat? Enter your stats below to get your “Honest Grade” and find out where you rank!
Hitter’s Power Index (OPS)
Find out your true value at the plate.
Out of your Total Hits, how many were extra bases?
What Is OPS in Baseball?
“OPS,” or on-base plus slugging, is the best metric to gauge a player’s quality and team contributions. You just plug specific numbers into a formula to get your stats.
OBP is the combined numbers of a player’s on-base and slugging percentages that equal his slugging average.
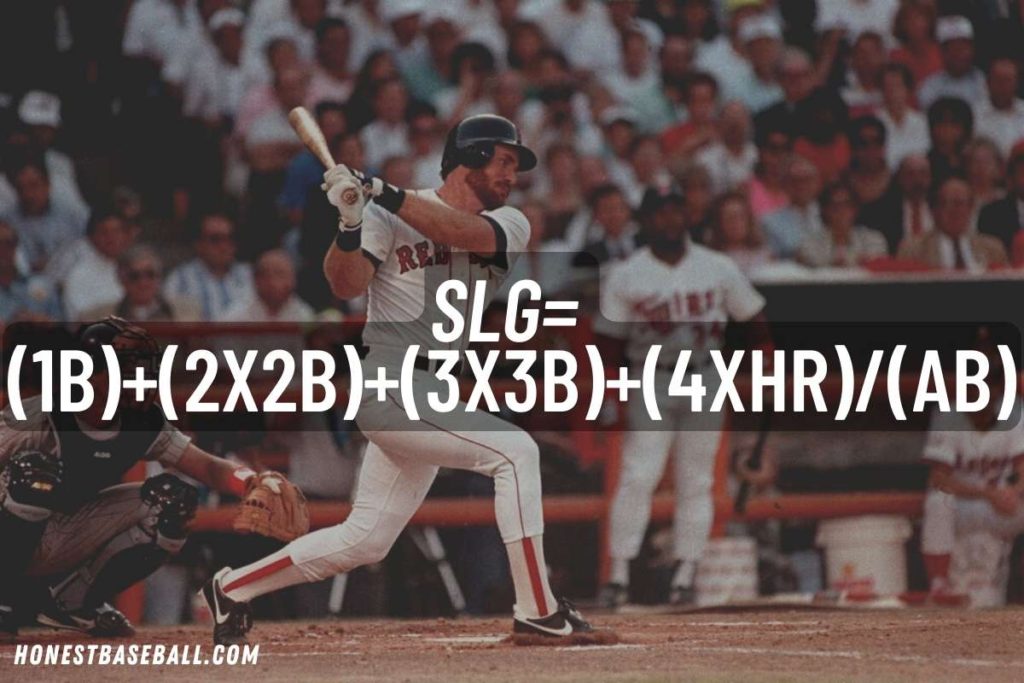
Slugging percentage gauges a batter’s ability to hit doubles, triples, and home runs. A player’s slugging percentage is the number of bases per bat. The metric is determined by dividing total bases by at-bats.
OPS is the combination of OBP and a slugging percentage of a hitter. The statistic was created so batters could be rated on their ability to do the two things most valued by baseball managers: get on base and hit for power.
On-base percentage wins above replacement (WAR) and slugging percentage are just a few of the sabermetrics numbers that have become commonplace on baseball cards and broadcasts. For MLB analysts, OPS is the end-all, be-all measure of a player’s value.
At first glance, this may seem a complex statistic, but it only requires some decomposition into its parts. These stats compare greats like Rogers Hornsby, Jackie Robinson, and Ted Williams.
The 2019 MLB batting average on-base percentage was .323, while the slugging percentage was .435. Combining these two figures shows that the 2019 league OPS was .758.
These values, along with batting average and ERA, are “rate stats,” or ratio- and percentage-based statistics.
However, these percentages will always be shifting as new data is added. OPS and similar statistics are less susceptible to extreme outliers from small or large sample sizes due to their ratio-based rather than accumulation-based nature.
Because OPS seems to keep up better with counting figures over time, this could assist evaluate batters, even if they have vastly different playing times.
Additional Read: Baseball Statistics for Beginners.
OPS In Major League Baseball
The typical OPS for an MLB player is around.750. This varies from year to year, however, and is often determined by the quality of MLB pitchers that year.
Are you afraid of pitchers when they throw a stunner? I was afraid too. So you may questions "How Do I Stop Being Scared of Fast Pitchers?" It is a simple yet complicated answer. Here are some of the methods you can use.
A player with an OPS above 1.000 is exceptional in the big leagues.
In most seasons, few players with more than 500 at-bats reach an OPS of 1.000.
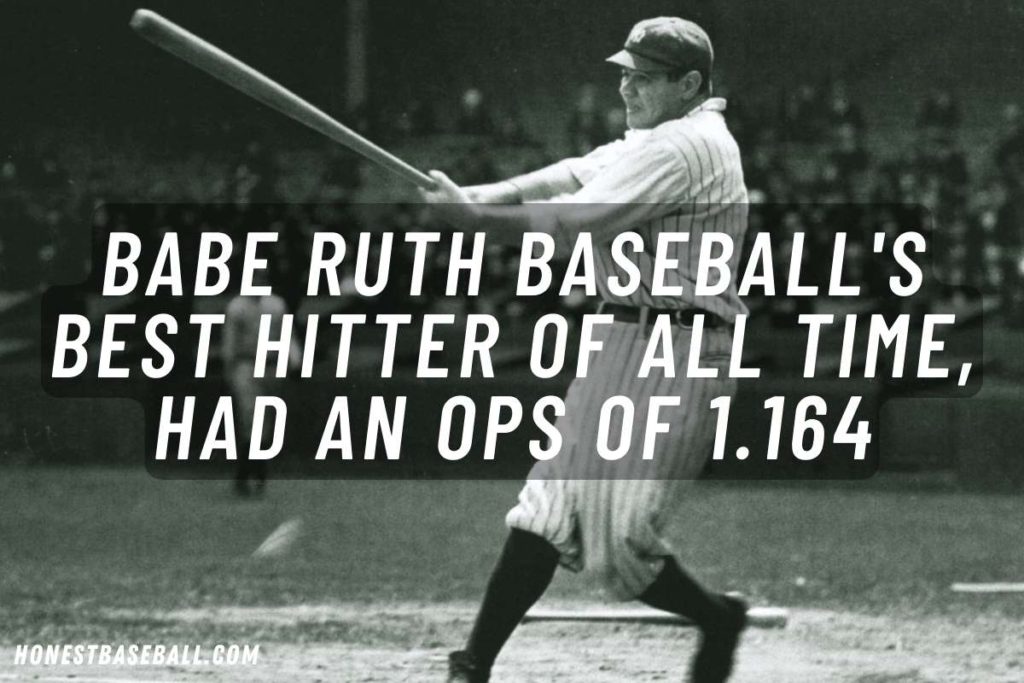
Only seven MLB players have retired with a lifetime OPS of 1 or above. Babe Ruth holds the lifetime OPS record, with a 1.1636 career OPS when he retired.
Players who retired from MLB with a lifetime OPS of 1.000 or higher:
| Player name | OPS |
| Babe Ruth | 1.1636 |
| Ted Williams | 1.1155 |
| Lou Gehrig | 1.0798 |
| Barry Bonds | 1.0512 |
| Jimmie Foxx | 1.0376 |
| Hank Greenberg | 1.0169 |
| Rogers Hornsby | 1.0103 |
OPS Outside of the Major Leagues
Extremely talented baseball players may frequently outperform the league averages in several hitting categories, including OPS. This is due to a far greater disparity between hitter and pitcher ability levels than exists in the big leagues.
For example, a major league batter will see some of the best pitchers in the world, while a great high school batter might see some of the weaker ones.
When evaluating players at the minor league level, it is more useful to compare their numbers with those of their counterparts than to those of big leaguers.
How To Calculate OPS?
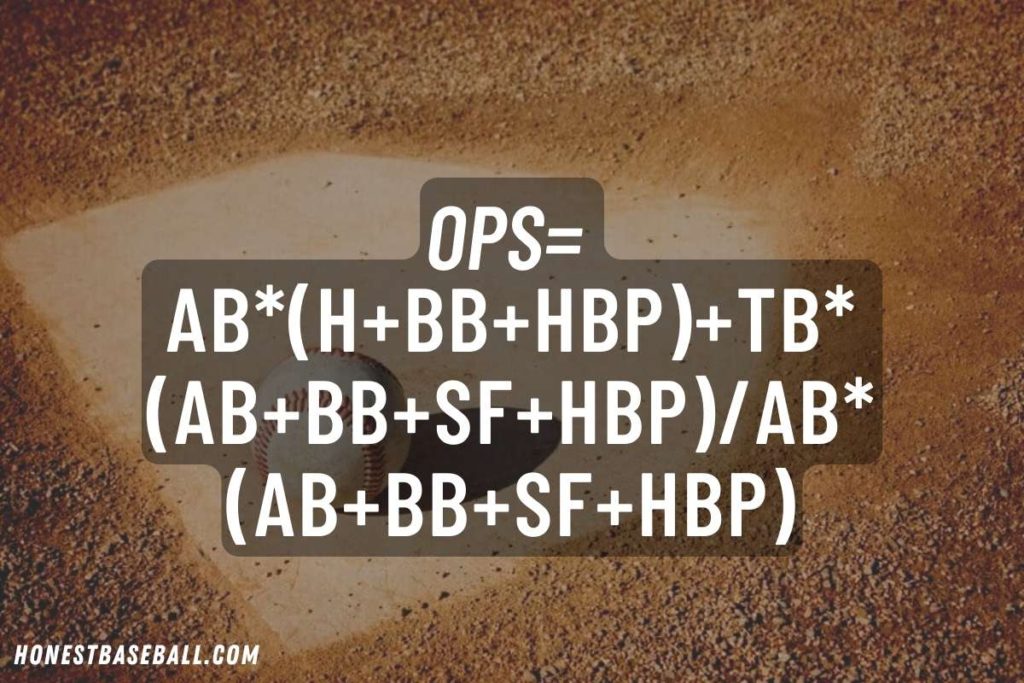
As we discussed before, a player’s OPS is their average batting on-base plus their slugging percentage. A simple OPS calculation is adding the two numbers. However, calculating a batter’s OPS is very difficult without such data.
As a whole, the OPS equation is somewhat complicated and time-consuming to solve.
As a whole, the OPS equation is somewhat complicated and time-consuming to solve. In this way, you can get fast and accurate results. That is because the denominators in the OBP and SLG calculations are different.
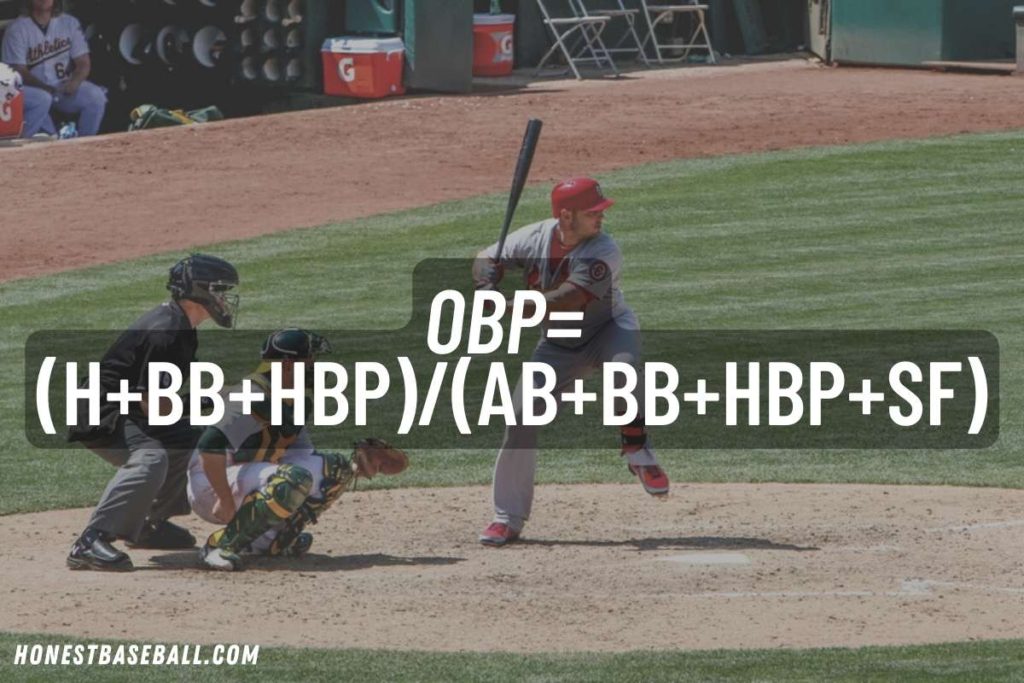
To get a player’s on-base percentage, sum up their number of hits, walks, and HBPs. Then divide that number by their number of at-bats plus the number of sacrificial flies and HBPs.
Alternately, you can prioritize bat appearances without sacrificing bunts. Hence, the formula for OBP is as follows:
On-base Percentage (OBP) = Hits + Walks + Hits by pitch (HBP) / (At Bats + Walks + HBP + Sacrifice Flies).
Calculating a batter’s slugging percentage, or the number of bases he earns due to his hits is far easier than calculating his average or on-base percentage.
As you have those two numbers in hand, you can readily get your OPS by simply adding them together.
Say a batter goes 40 hits in 100 at-bats with ten doubles, ten triples, five home runs, ten walks, five hit-by-pitches, and five sacrifice flies.
The sum of the on-base percentage of 40 hits, ten walks, and five hit-by-pitches is 55. There were a total of 130 contact attempts (100 at-bats plus ten walks, ten sacrifice flies, and ten hit-by-pitches). If we divide 55 by 130, we get a .423 slugger’s on-base percentage.
When you combine the total bases scored by your singles (20), doubles (10), triples (5), and home runs (15), you get 50. Now, divide that by your total at-bats (100), and you get a slugging percentage of .500.
The hitters combined .423 OBP, and .500 SLG provides a .923 OPS. Simple! Isn’t it?
The formula used to determine OPS.
With all that math, it is generally preferable to compute the two figures independently.
There are different bats in the market. But to rank up your OPS USSA bat is a great choice for professionals. Check out these 15 Best USSSA Bats 2022 to boost your batting level and help your team win the game.
OPS Formula Example
Let us imagine a player’s slash lines look like this. Their batting average is.385, and their slugging percentage is.435.
When you put up his batting averages of .385 and .435, you get an OPS of.820. A player with an OPS of.820 would be considered a decent one in Major League Baseball but not good enough to make the All-Star team or win the MVP award.
The next slash lines apply to a different player. They have a.475 OBP and a.505 slugging percentage.
If you combine the two, they have an OPS of.980, which is high enough to be considered for All-Star and MVP honors.
Problems with Baseball OPS Scoring Calculation.
While both on-base and slugging percentages are essential measures of a batter’s performance, they are insufficient.
There is a significant percentage discrepancy between these parts.
However, whereas OBP’s scale extends to 1,000, SLG’s ranges from 0 to 4000. Due to its limitations, OPS has been criticized by those who argue that it should not be used as the only metric for evaluating a player’s value.
Importance Of OPS In Baseball
Before the year 2000, Major League Baseball (MLB) was split into the National League (NL) and the American League (AL). The Professional Baseball Commissioner assumed control of both leagues and the whole sport in 1920.
The on-base plus slugging (OPS) is a valuable statistic for analyzing a player’s performance on the field. This statistic accounts for the batter’s ability to reach base safely and his ability to hit for power.
This implies that it considers the hitter’s batting average and slugging percentage (SLG). When these two numbers are added together, the result is the OPS.
The OPS is a widely used metric in MLB to assess offensive production at the plate. It is calculated by combining a player’s batting average and on-base percentage.
Why Is OPS a Good Statistic?
Until recently, on-base plus slugging percentage was a statistic that was often overlooked, despite its obvious relevance to baseball.
OPS is one of the simplest “technical” metrics to measure and utilize, combining the values for getting to base and striking for power.
These two facts make OPS a convenient metric for fans to locate, calculate, and analyze. OPS is also used by teams to evaluate a player’s ability to both reached base safely and produce big hits.
Yet, OPS is not 100% reliable.
OPS is impacted by ballparks that favor batters or pitchers and league-wide factors that favor offense or pitching.
Another metric, OPS+, was developed to account for the fact that OPS may be affected by things like ballpark size and league-wide rule changes.
The OPS+ statistic is far more complicated, as it adjusts each player’s OPS by league and park characteristics before comparing it to a base of 100.
Is OPS Good In Baseball?
As we discussed previously, OPS requirements might change as leagues and stadiums evolve. Still, specific generic statistics are regarded as excellent or poor.
In baseball, an OPS of.800 or higher indicates above-average skill, while.900 or higher indicates tremendous talent, and 1.000 or above indicates outstanding mastery. However, an OPS below.700 is regarded as bad, and an OPS below.600 is considered extremely poor.
Bill James, a pioneer in baseball statistics, further subdivided players into seven groups (labeled A through G) from “Great” to “extremely poor” in 2009.
He specifies an OPS of .900 or above as excellent, .833 as good, .767 as above average, .700 as about average, .633 as terrible, and .567 as extremely poor.
Baseball is a game of records. Grand Slam is an extraordinary way to do it. But do you know What Is Grand Slam in Baseball ? It is an immersive batting skill that you should know about.
What Is the Difference Between OPS and Batting Average
OPS is calculated by adding a batter’s on-base percentage to his slugging percentage (SLG). Although OPS gives us more information than the batting average, it still requires context.
In most cases, OPS will be greater than the batting average. If you take the OPS and divide it by 3, you get the batting average.
If your OPS is 0.900, your batting average at the plate is 0.300. Not all hitters with identical BA and OPS will be the same players.
OPS is used to measure a batter’s abilities. Being safe at first base is a strong predictor of helping the team’s run total.
This is true regardless of how the player reaches base. That is why the on-base percentage is a better indicator of a batter’s efforts than the batting average, which divides hits by at-bats.
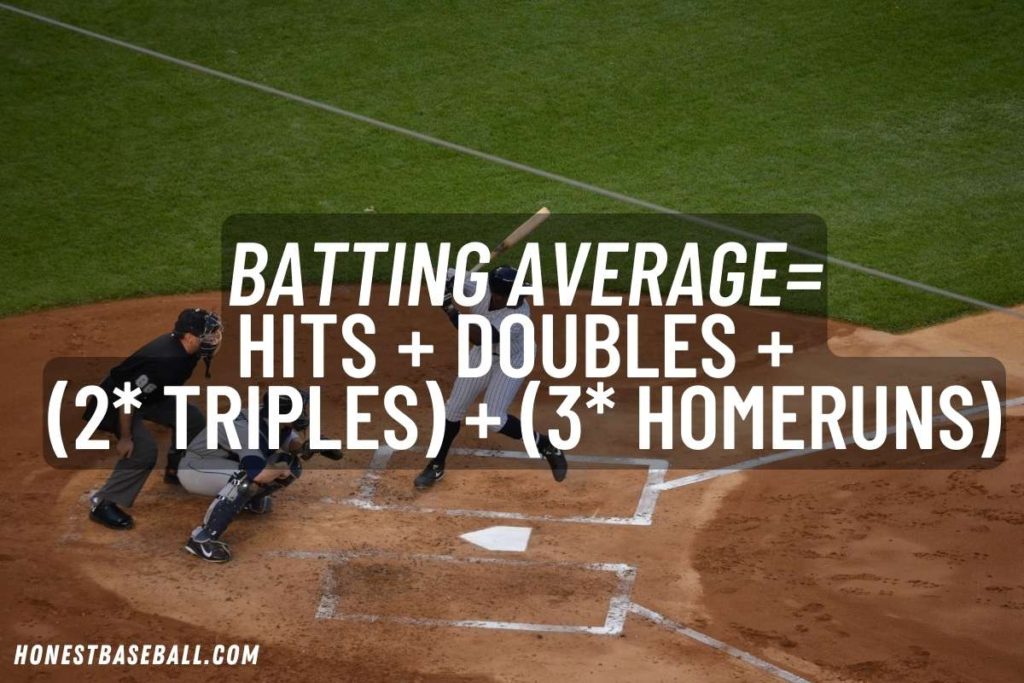
Figure 6- Batting Average (BA) Formula
OPS also incorporates slugging percentage to credit hitters for their ability to collect hits, particularly those that result in extra bases. The OPS statistic takes into account the fact that a double is more beneficial to a club than a single.
The OPS system offers more credit for home runs than any other kind of hit because of how valuable they are.
When Did Baseball Introduce OPS?
The calculation of On-base plus slugging is around for decades.. In the 1940s and ’50s, Branch Rickey pioneered the concept of an OPS statistic by developing the on-base percentage.
He is also the pioneer of the concept of “Extra Base Power,”. He figured that the two statistics might be combined to provide a more complete picture of a batter’s performance.
Apparently, Rickey was way ahead of his time with his vision.
It was not until the mid-1980s that OPS became well recognized, thanks in large part to the work of amateur statisticians. OPS (and its constituents) was not given much attention in baseball till the advent of advanced statistics in the 1990s and early 2000s.
Also, the on-base percentage was not seen as important until the 1990s, but the slugging percentage was recognized earlier for its link with power hitting.
Despite OPS’s widespread popularity and widespread acceptance today, it is not an official statistic in Major League Baseball.
However, you can find OPS figures, on many baseball cards, on various statistics websites, and even on the scoreboard at specific stadiums.
When you see a batter’s OPS from now on, you will have a better notion of whether or not you should feel confident in the person at the plate.
What is OPS+?
Another metric, OPS+, “normalizes” the original OPS so that it may be compared more easily from team to team. OPS+ takes into account contextual elements like the stadium in which a player was batting. This metric is skewed such that 100 represents the league average, thus it is easy to see how a player’s offensive output stacks up against the rest of the league.
For this reason, a player’s stats for the Cubs may seem different from those of the Dodgers, who may look different from the Cardinals or the White Sox. The “+” at the end of a player’s OPS is an attempt to level the playing field.
For example, if a player’s OPS+ is low and he wants to play in a smaller stadium where home runs are easier to come by, his OPS+ will go up if he signs with a new team.
What Is The Difference Between OPS And OPS+?
As I have previously explained, the OPS is calculated by adding the hitter’s On-Base plus Slugging percentages. It disregards two factors: other players and baseball parks.
Since OPS+ is a comparison statistic, its value is normalized to make 100 represent the middle value of its distribution. As a consequence, an adjusted OPS of 99 indicates below-average performance, while an OPS+ of 101 indicates above-average performance.
The OPS+ stat is calculated by adjusting a player’s batting average for league and ballpark impacts, among other variables.
A player’s performance is evaluated relative to that of the rest of the league and to that of other players who have batted at the same park.
Due to the fact that everything is normalized to the league average (which is set to 100), OPS+ operates a bit differently than OPS.
For example, David Ortiz’s OPS+ of 164 in 2016 indicates that his performance was better than average by 64.9 percentage points compared to a hitter in the same league and park.
Controversies Over OPS
Though OPS has its fans, other statistics, including batting average, plate appearances, and home runs, are often seen as more accurate indicators of a baseball player’s performance. OPS is a popular metric, although detractors have pointed out various flaws.
These concern the relative worth of a hitter’s different outcomes to the team and the strength with which particular statistics predict a team’s success. OBP is more closely connected to team performance than SLG, although the OPS algorithm gives both equal weights.
Another complaint about OPS has to do with the way the slugging percentage is calculated. The SLG system assigns a value of two to each unit, with three to a triple, and so on.
However, research has shown that there is far less variation in terms of team value across the different sorts of hits. A double is worth 40% to 60% higher than a single, a triple 70% to 130% more, and a home run 120% to 200% more.
Consequently, some argue that slugging percentage (and, by extension, OPS) places too much emphasis on home runs.
Can We Get Better Numbers Than In OPS?
Yes! There are better stats than OPS. The wOBA and the wRC+ are better and more accurate. How a player reaches the base is included in the wOBA statistic.
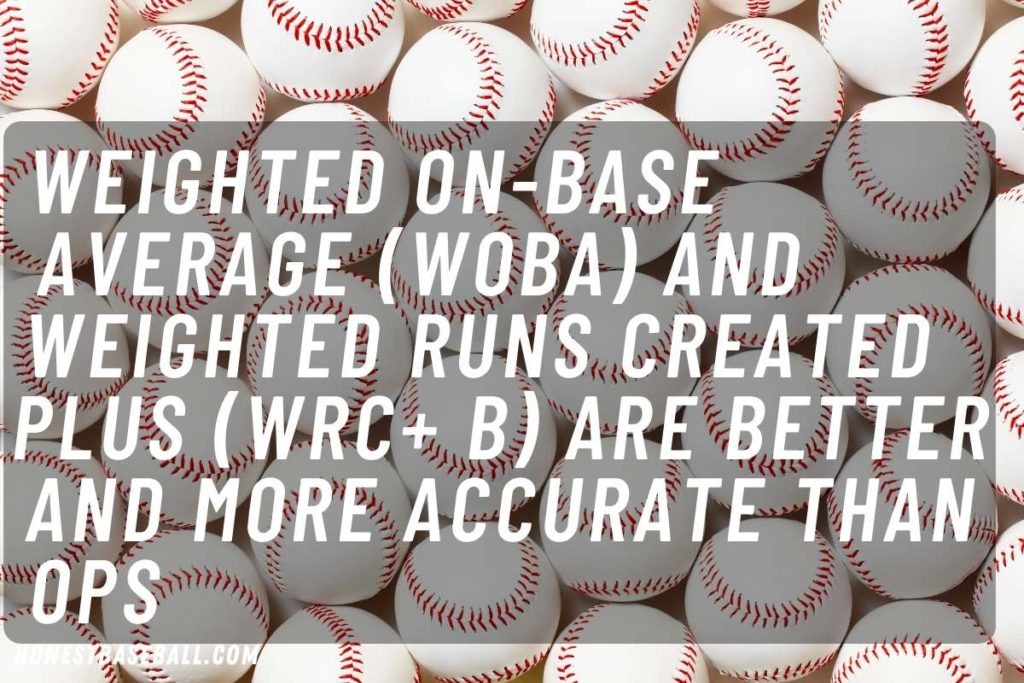
Figure 7- Weighted On-base Average (wOBA) and Weighted Runs Created Plus (wRC+ B) are better and more accurate Than OPS.
After a runner reaches base, the odds of making it to home plate are evaluated. This wOBA aims to show how valuable an offensive player is to his team.
wRC+ is a more precise indicator of a batter’s offensive production than OPS. A batter’s effect at the plate, as measured by his wRC+, is the sum of his efforts in scoring runs.
Increasing your wRC+ means you are more likely to hit safely, less likely to strike out, and more likely to walk the pitching staff.
Don't you like double plays in baseball? It is one of the most exciting moments. But there is the more advanced level which is called 6-4-3. Interested yet? Know 6 4 3 Double Play Forensics here.
Who Holds the Record for the Highest OPS Ever?
Babe Ruth, perhaps baseball’s best hitter of all time, had an OPS of 1.164 during his 22-year professional career. In addition, only seven batters in history have retired with an OPS greater than 1.000; Mike Trout is on the cusp of joining that exclusive company.
What Exactly Does a Batting Average Count For?
In baseball, the batting average is determined by dividing the number of times a player gets on base by the number of times he gets up to bat. You will obtain a percentage that reflects a player’s hit rate or, more accurately, how well he can hit the ball.
The batting average is one of the most misinterpreted statistics in baseball since players have considerable control over it.
Batting Average on Balls in Play (BABIP) is the single most important factor in establishing a batter’s batting average. As an alternative explanation, BABIP tracks the percentage of batted balls that result in base hits.
Hits minus balls put in play is the formula used, with balls put in play standing in for at-bats. For instance, a .500 BABIP would result from a situation in which the batter hit 5/10 balls in play.
Frequently Asked Questions
1. What Is A Good OPS In Baseball?
Players in Major League Baseball who have an OPS of.800 or greater are considered to be among the game’s best hitters. The player who leads the league in OPS will often have a score that is close to, and occasionally even higher than, 1.000.
2. What Is The Difference Between OPS And OBP?
The OPS measures a batter’s overall performance by combining his OBP and slugging percentage. OPS is often used as a barometer of a batter’s proficiency. Running up a team’s run total is strongly correlated with making it to base safely without getting out.
3. What Is SLG In Baseball?
Slugging percentage, abbreviated SLG, is a measure of a batter’s ability to reach base safely in a given number of at-bats.
The most notable distinction between the batting average and slugging percentage is that the latter does not give the same weight to each hit. The calculation for the batting average is as simple as dividing the number of hits by the number of at-bats, while SLG requires more work.
4. Can OPS Be Used To Evaluate The Pitcher’s Performance?
Yes. To measure a pitcher’s effectiveness, the OPS (in the context of baseball) is only useful in very unusual circumstances. The acronym “OPS” here stands for “OPS against” or “OOPS” (opponent on-base plus slugging).
5. Do Walks Help Your OPS?
One base is awarded for walks, two for singles, three for doubles, four for triples, and five for home runs in OPS. Nowadays, OPS is a standard statistic utilized in baseball discussions and often factors into the debates over league MVP awards.
6. What Is the Best Ops in a Season?
Barry Bonds set five big league records in 2004, including an on-base plus slugging percentage of 1.422 and an on-base percentage of .609. His career slugging percentage of .812 remains an MLB record.
Final Words
OPS can simply summarize a batter’s performance on the field. It also works well as a holistic approach to calculating, analyzing, and judging the player’s performance on the field.
Finding the answer to “what does OPS mean in baseball” is a triumph for both the inquisitive audience and the dedicated baseball player.
It is helpful to combine his on-base and slugging percentages to get a fuller picture of a player’s offensive output. As with most baseball sabermetrics, it is difficult to quantify everything without seeing it.
Combining OPS with other stats may assist in illustrating a player’s whole picture. The OPS is a highly helpful statistic since all you have to do is add up the player’s on-base percentage and slugging percentage.
You are now an OPS expert. You, too, can figure out your OPS and compare it to that of your favorite players. So, work on improving your OPS and tracking your progress against other metrics at the same time.
You May Also Be Interested In-
Can Pitchers Fake a Pickoff Attempt? Know the Rules from a Coach
What Is Offense in Baseball? (Including Skills & Strategies)
What Is a Good ERA in Baseball? | Critical Facts Explained
6 4 3 Double Play Forensics – All Exciting Baseball Plays Explained!
Hello everyone. My name is Jason Butler, and I live in California, America. I was a professional AAA Minor League Baseball player. I lost my chance of playing MLB for injury issues, but I did not lose my love for baseball. I attended the coaching training program and am now working as a coach in a small school in San Diego.
I always love to share my experience and knowledge if that can help you. Play baseball, and stay fit.