Have you ever watched a baseball game and heard commentators talking about things like batting averages and ERAs? If so, then you’ve already been exposed to the world of baseball statistics!
Baseball stats are used to measure player performance in order to understand and appreciate the nuance of the game. In this article, we’re going to explore some of these statistical figures more deeply – from the common stats that everyone is familiar with, such as batting averages and home run totals, all the way through less well-known categories like walks plus hits per inning pitched (WHIP).
Ready for your crash course in baseball stats? Let’s dive in!
Batting Statistics
At Bat (AB)
At Bat, or AB, is an important statistic in baseball. It measures the total number of times a player stands at home plate and is called upon to bat in a game. It may seem like a simple statistic, but it does not always accurately represent how well a player has played.
Factors such as whether the batter walks or strikes out, sacrifices, or fouls off count against his AB totals but do not necessarily reflect their overall performance. Additionally, at-bats that occur in extra innings are included even if the game is ultimately called due to darkness or another reason; this, too, can be an inaccurate indication of how often the batter has taken part in offense during regulation play.
Despite its limitations, At Bat is still widely used to gain important insight into how many times each individual participates in batting plays and therefore helps to give an overall picture of performance throughout the game.
Palate Appearance (PA)
A plate appearance in baseball refers to the entire duration of a batter’s turn at-bat. It starts the moment he steps into the batter’s box and ends when he is put out, hits a fair ball, or puts a ball into play with a foul swing of his bat. A Plate Appearance (PA) consists of any possible outcomes, including strikes, balls, pitch hits, and walks. All these outcomes are tallied up when calculating statistics such as On Base Percentage (OBP).
The PA helps to provide an overall picture of a batting performance’s success. Analyzing each player’s PA can also be used to establish their offensive style and help build an effective team lineup strategy.
AB/HR (At bats per home run)
AB/HR (At bats per home run) is a metric used in baseball to evaluate a player’s power. It is calculated by dividing the number of at-bats with a home run by the total number of at-bats.
AB/HR can be used as an indicator of a player’s power, and it can also be used to compare players across seasons or leagues. For example, Babe Ruth had an AB/HR of .345, which means he hit home runs in 33% of his at-bats. Miguel Cabrera has an AB/HR of .466, which means he hits home runs in 46% of his at-bats.
Runs Batted In, or RBI
Runs Batted In, or RBI, is an important statistic used to measure a baseball player’s performance. It records how often a batter is responsible for getting teammates on base by hitting safely or having balls they hit be fielded in such a way that results in players on base being advanced. RBIs are also awarded to runners when an opposing player commits an error while fielding.
Generally speaking, players who drive in lots of runs are at the heart of championship-winning teams and have been celebrated as great hitters since the sport arose. MLB batting titles often go to players with some of the highest numbers of RBIs each season, so if you’re looking for the cream of the crop out there on the diamond, keep your eyes peeled for plenty of RBIs!
Want to learn more about RBI? Read my detailed article: what is RBI in Baseball
Hit
Hit in baseball is a statistic that many fans, players, and coaches keep track of. A hit is when a batter successfully makes contact with the ball and reaches base without the help of an error or fielder’s choice. If a runner on base advances due to the batter’s hit, it does not count as an additional hit for the batter.
Hits are seen as a true measure of success for batters; having more hits than other batters reflects both technique and talent. Whether someone is smashing home runs, reaching base on singles, or getting doubles off the wall, all these scenarios would be considered one hit each for the batter. Professional baseball teams take into account hits when selecting their players and evaluating their performances.
Though some people have different criteria when measuring success in baseball, getting a hit is still highly encouraged by coaches and fans alike.
Want to be a better hitter? Learn from How to be a better hitter.
Foul ball
A foul ball is one of the most exciting aspects of a baseball game. It occurs when a batter hits the ball, and it lands outside of the foul lines that extend from home plate. A foul ball can cause quite a stir in the stands, as its unpredictability often leads to long drives and exciting plays.
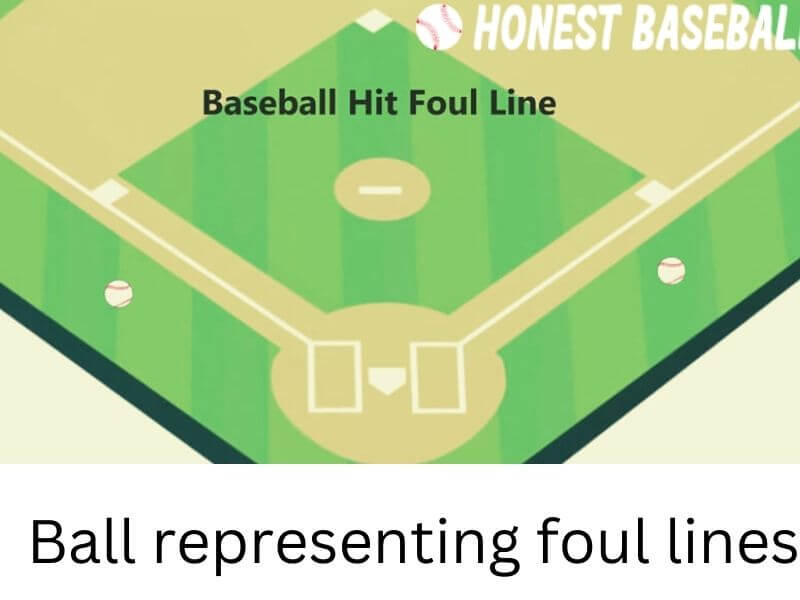
Although foul balls aren’t considered official hits, they can still be precious for teams with runners on base – if caught or touched by a fielder, the baserunners are allowed to advance regardless of how far the ball is ended up traveling. Foul balls truly add an extra element of surprise and excitement to every game, making them one of the most interesting parts of baseball!
Learn more about the foul ball.
Base on Balls (BB)
Another way to describe it is “walk”. Base on Balls (BB) is a unique and important rule in baseball. It’s the only time that a fielder does not need to put the ball in play for an offensive player to reach first base. When a pitcher throws four “balls” consecutively, outside of the strike zone, it results in a BB for the batter, and they are automatically granted first base.
A BB can also be given if a fielder ‘interferes’ with a batter while on their way to the plate, another situation in which no contact with the ball is needed. BBs can be extremely beneficial to batters who want to get on base or increase their team’s chances of scoring. Overall, knowing when and when not to throw BBs is an integral part of playing effective baseball.
On-base percentage (OBP)
On-base percentage (OBP) is a slightly underrated but essential metric in evaluating a baseball player’s performance. It is calculated by taking the number of times a batter reaches base (hits, walks, and hit-by-pitches combined) divided by the total number of plate appearances.
OBP measures more than just batting averages because it considers other opportunities to get on base, such as when the batter draws a walk. An important thing to consider with OBP is that getting on the base not only helps your team score runs but also gives other players better chances at success.
Generally, hitters with high OBPs will see their teammates benefit from higher RBI totals and run totals as well; in fact, OBP often acts as an indicator of success at the plate, which makes it an invaluable statistic for coaches and players alike.
Slugging (SLG)
Slugging (SLG) is an important statistic in baseball. It measures a hitter’s ability to hit for power, telling us how often they’re able to get extra bases on a single hit. Put simply SLG is determined by taking the total bases obtained divided by at-bats. In other words, the numerator of the equation is the sum of a player’s singles, doubles, triples, and home runs, while at-bats make up the denominator part of it.
A rarity in baseball, slugging over .900 puts you in elite company when hitting and past legends such as Ted Williams and Babe Ruth have done it before. Therefore, SLG gives us an idea of whether a batter’s plate appearances result in them getting around the bases or not, which obviously relates to their offensive contribution. It’s easy to see why SLG has been such a popular statistic for so long – it tells us just how well hitters are performing at getting extra bases!
Strike Out
A strikeout in baseball is a situation when a batter has failed to hit the ball after three tries. Generally, it happens when a pitcher throws a ball that the batter takes no action on or swings and misses. A strikeout is also known as “K” in official scorekeeping.
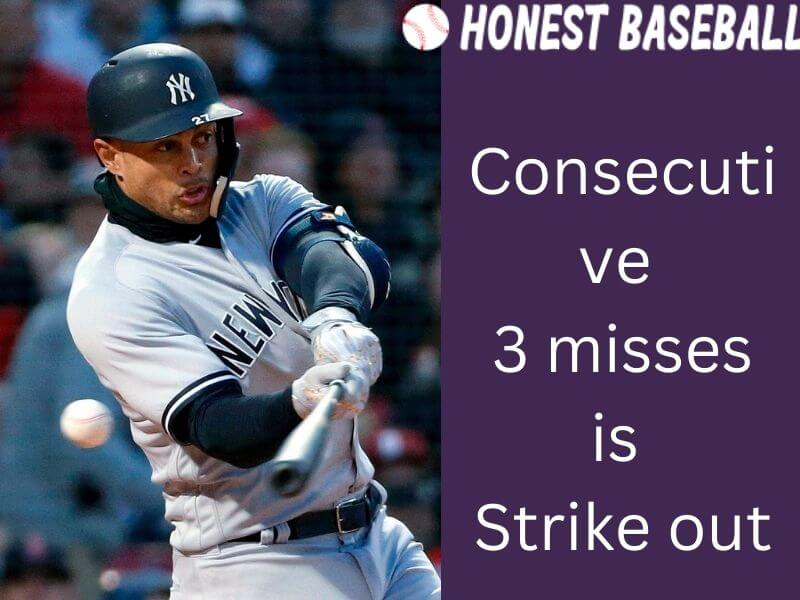
Strikeouts are recorded whenever an umpire judges that the pitcher has beaten the batter in terms of skill or speed. Accumulated strikeouts over the course of a season make up what is known as a pitcher’s K-totals.
Examining players based on this statistic may paint an accurate picture of their skills as it demonstrates their ability to outsmart their opponents.
On-base plus slugging
On-base plus slugging, or OPS is a statistic used to gauge the overall effectiveness of an individual baseball player’s offensive contributions.
It is calculated by adding a player’s on-base percentage and their slugging average, both of which indicate the player’s ability to get on base, their power-hitting potential, and their number of total bases.
OPS has become increasingly popular over the years as it provides an easy look at the overall offensive production of a particular hitter in one quick glance. The higher the OPS, the better the player performs at hitting and getting on base in a given season.
On-base plus slugging (OPS) is a valuable stat when it comes to evaluating a baseball player’s offensive abilities. It’s calculated by adding the player’s on-base percentage, which measures the number of times they get on base, to their slugging percentage, which accounts for the total bases they gain while hitting.
An OPS score is made up of two numbers – one that reflects how often a batter gets on base and one that shows their ability to generate an extra-base hit. To put things into perspective, an OPS of 1.000 or greater is considered superior.
For example, Mike Trout’s 2020 OPS was 1.010, which demonstrates his elite offensive capabilities at the plate. At the other end of the spectrum, a label like “replacement level OPS” denotes a score below .700 and indicates someone who won’t bring much offensive value to the team or has many opportunities to bat in games.
Home Runs
Home runs, also known as HRs in baseball, are a big part of the game. They’re when a batter hits the ball out of the ballpark, scoring run-by-runs for their team and themselves. The most iconic home runs have become memorable events and often end up in highlight reels.
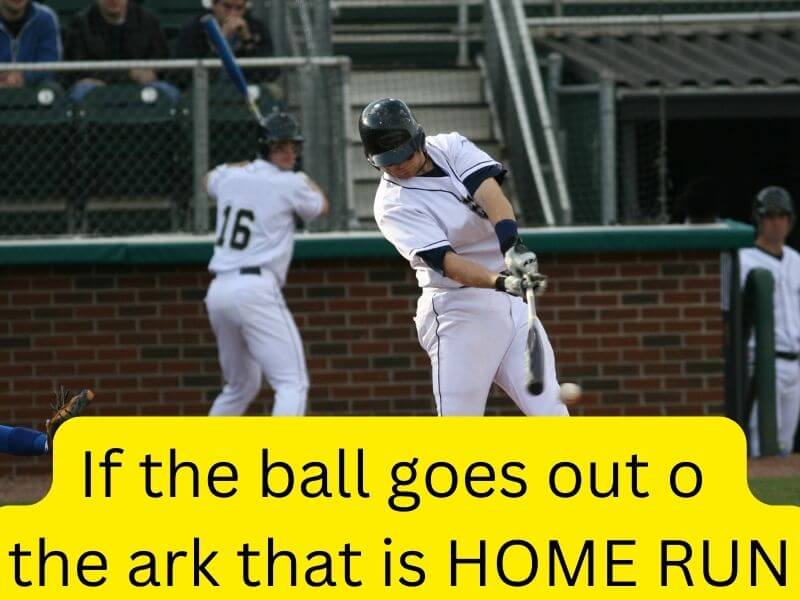
For example, New York Yankees legend Derek Jeter hit a career total of 260 home runs over his 20-year tenure with the team. Similarly, Los Angeles Dodgers slugger Cody Bellinger smacked an impressive 47 home runs during the 2019 season alone! Watching these players illustrate power through HRs is truly a sight to behold, making this feat one of the fan favorites to witness during games.
Want to know more about the home run and learn how to hit one? Read my article – what is home run with 4 drills to learn to hit one.
Hit-by-pitch baseball “HBP”
Hit-by-pitch baseball or “HBP” is an exciting variation of the classic sport, making use of all the traditional rules and regulations with a few notable exceptions.
This type of baseball still makes use of a bat, bases, gloves, and even home runs – but instead of being pitched to a batter at the plate, a rubber ball is thrown directly at them!
With its simplified rules and quick, action-packed gameplay, HBP provides hours upon hours of fun for players big and small. As with any sporting game, the goal is to score points – but in HBP, there are no strikes or ‘fouls’ – if you’re hit with the ball, you automatically earn one point for your team. Not only does this add an extra level of excitement to the game itself, but it also encourages players to be aware and active on defense.
Total Average (TA)
Total Average (TA) is a statistic in Major League Baseball that measures offensive performance as opposed to other stats, such as batting average. It takes both hitting and baserunning into consideration and assigns each event a numerical value—more valuable moments are assigned higher values, so home runs will have a higher value than singles, for example.
TA looks at the total number of bases a player has been credited with over the course of an entire season or their whole career. It’s an all-encompassing statistic reflective of an individual’s overall engagement in the game. A player may not have the highest batting average in the league, along with fast running abilities, but if they manage to rack up extra bases, which add to their total average, then they can still be one of the best players in their position statistically.
Pitching Statistics
Innings pitched (IP)
Innings pitched (IP) is a statistic used to measure the effectiveness of pitchers in baseball. IP, calculated by dividing the total number of outs obtained by the number three (a team making three outs equals one inning pitched), is an important tool that helps to evaluate a pitcher’s endurance and effectiveness over time.
A pitcher who has pitched multiple innings is considered tough, while if a pitcher only goes out for one inning, he or she may not be able to maintain consistent pressure on the opposing team’s offense. Innings pitched is also oftentimes used as an indicator for when a pitching change should be made, as tired arms tend to perform less effectively later in games.
A good IP measurement indicates that a pitcher is able to consistently assess and adjust to different game situations, contributing significantly to their team’s success.
Pitch Count (PC) and Strikes (ST)
In baseball, there are two important measurements to bear in mind — Pitch Count (PC) and Strikes (ST). Pitch count is the number of pitches thrown by a pitcher during a game. This is an important metric because it indicates the efforts of the pitcher, helping to determine how long they can remain in the game.
Strikes are simply defined as pitches thrown from the pitcher that the batter does not hit or contain fouls. The goal for pitchers is to get these strikes recorded, as it not only earns them points but also shows their accuracy and skill level. Both PC and Strike count improve with practice, leading to better performance and success on the field.
Earned runs (ER)
Earned runs (ER) in baseball refer to the number of runs that a team scores as a result of their own offensive play rather than as a consequence of errors by the other team. It is sometimes referred to as an earned run average since it is expressed as a ratio of runs allowed per nine innings and is calculated solely from the performance of the pitching staff. Contrary to unearned runs, earned runs count towards both the pitcher and his team’s record.
This means that even if the hitter makes contact with the pitch and strikes out or flies out if the runner scored due to their effort rather than an error, then it still counts as an earned run. Knowing how to differentiate between earned and unearned runs can give you an improved understanding of a pitcher’s record, giving you insights into their true ability.
Earned run average (ERA)
Earned run average (ERA) is an essential metric in baseball that measures the number of runs a pitcher allows per nine innings. It’s expressed as a number, usually rounded down to one decimal place. To calculate ERA, simply divide the number of earned runs given up by a pitcher over the total innings pitched and multiplied by nine.
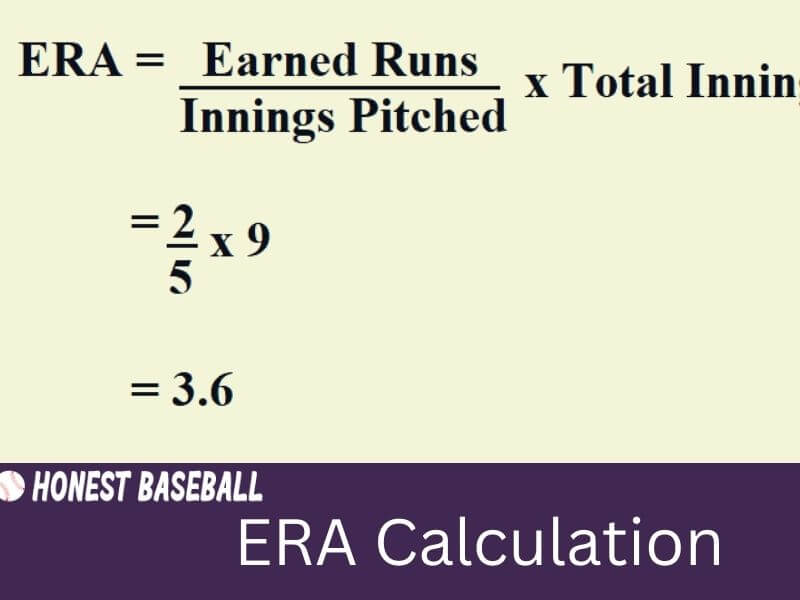
The lower the ERA, the better—generally speaking, good pitchers strive to keep it at under around 3.50 or lower. To illustrate this concept, let’s consider two hypothetical pitchers: One with 10 earned runs in 20 innings pitched gives them an ERA of 4.50, while another who has allowed only 5 earned runs in 25 innings gives them an ERA of 1.80—a much more impressive stat!
If you still feel confused, I have two separate articles on it.
What is a Good ERA in Baseball?
Field Independent Pitching (FIP)
Field Independent Pitching (FIP) has been used in the Baseball world for a number of years – more specifically, since 2012. It is a pitching statistic that focuses on the pitcher alone, helping to remove outside influencers such as the quality of fielders around them on any given play.
FIP measures outcomes with greater accuracy than other stats and can be determined by looking at elements like walks/strikeouts given, hit scatter, and home runs allowed. Additionally, this metric can offer insight into aspects such as pitch type effectiveness and velocity over time.
In summary, FIP provides more confidence that all factors are taken into consideration when assessing each pitcher’s performance, making it an invaluable tool for baseball coaches and scouts alike.
Walks plus hits per inning pitched (WHIP)
Walks plus hits per inning pitched (WHIP) is an important metric used to evaluate the performance of a baseball pitcher. It measures how many baserunners a pitcher has allowed over the course of an inning: one walk or hit counts for one point, and two walks or hits count for two points. The lower a pitcher’s WHIP, the better their performance in preventing opposing teams from getting on base. This stat helps baseball managers decide when to substitute pitchers and can be especially useful when analyzing relief pitchers and closers who only come in late in games. Ultimately, WHIP is a great tool that allows coaches to make informed decisions about their team’s pitching lineup.
You learn in detail about WHIP from this article – what is WHIP in Baseball?
Save
Save pitching statistics are an important stat to consider when assessing the performance of a Major League pitcher. For any pitcher who makes an appearance in a game, the Saves stat reflects how many games they “saved” for their team by ensuring the victory after coming in for relief. To record a Save, a pitcher must enter the game with his team-leading by no more than three runs and protect that lead in either the 8th or 9th inning.
This highlights the importance of this statistic; it’s not usually given to just anyone but rather to specialists whose job is to close out games on behalf of their team. This can be seen as particularly noteworthy, recognizing that modern baseball games tend to have close scores, and leads can change quickly.
For certain pitchers, their legacy may one day be measured in terms of how often they put up strong numbers in the Save stat column.
Wild Pitch (WP)
WP (or Wild Pitch) is a term used in baseball to describe when a pitch is thrown so wildly that it cannot be controlled by the catcher. This results in the batter, or any runners on base, being able to advance an extra base.
This usually happens when the pitcher throws an unexpected pitch or tosses one too hard for their own good! WP can also result from a bad bounce off the plate. Needless to say, pitchers try their hardest to avoid this outcome as it can potentially cost them and their team the game. To minimize the chances of throwing WPs, coaches often teach pitchers proper technique and mental discipline.
Fielding Statistics
Double plays (DP)
Double plays in baseball are some of the most thrilling plays to watch. When an infielder fields a hard-hit ground ball, quickly turns and throws it to second base before the runner gets there to put out two batters on the same play, it can be an incredibly satisfying experience for fans and players alike.
Pulling off a double play is no easy feat and requires coordination among all four infielders. After a successful double play, watching infielders high-five as they celebrate their successes is always a great sight.
Fielding Percentage(FP)
Fielding percentage is one of the classic metrics used to measure a baseball player’s defensive performance. It’s calculated by dividing the total number of putouts and assists a player records in the field, divided by the number of total chances they face.
A perfect FP would be 1.000, as no errors would have been committed. As an example, a shortstop who has recorded 10 putouts, 22 assists, and 2 errors during a game will have an FP of 0.933 – meaning their errors accounted for 7% of their total chances faced that game. In comparison, an outfielder is facing two fly balls but recording no putouts or assists (and having both drops hit.) They’d have an FP of 0.000 – giving them the lowest score possible in Fielding Percentage!
putout (PO)
A putout (PO) or put is the act of making an out in a game of baseball. It is recorded for each player anytime a defensive player puts out a baserunner or batter with the ball by catching, tagging, or forcing them out.
For example, when a batter hits the ball and it’s caught before it bounces on the ground, that’s a PO because the fielder caught the ball. On the flip side, if the runner is running for first base and gets tagged out with the ball, that’s also a PO–the act of tagging someone with a live ball can be called a “force-out”.
Putouts are used to determine success on defense as they count in calculating various statistics such as Fielding Percentage and Earned Run Average (ERA). The MLB record holder for most career putouts belonged to Hall of Fame shortstop Ozzie Smith who had 9,375 in his illustrious career!
Range factor (RF)
Range factor (RF) is a statistic in baseball that measures how many plays a fielder makes for every nine innings. Its calculation is based on the number of putouts and assists made by a fielder divided by the total number of innings played on the field. Essentially, it gives an indication of how productive and efficient a fielder is at making plays – highlighting those with exceptional range and athleticism.
The range Factor can be seen as an extension of Defensive Runs Saved (DRS), which indicates how much overall value a fielder adds to the team. On its own, it doesn’t make the best metric to compare players on different teams, so use caution if you bear this in mind when comparing RFs between players.
Stolen bases
Stolen bases are one of the most exciting plays in baseball. They occur when a baserunner successfully proves his speed by taking off and beating the throw to their destination base. It takes a lot of skill, trickery, and timing; many of the game’s top players were excellent base stealers throughout their careers.
Stolen bases often help teams get a spark in the offense after a lull, as they can lead directly to a run being scored and put pressure on the defense. Whether it’s stretching it from first to third or swiping a bag at second base, stolen bases always inject some life into the game.
Conclusion
Baseball statistics are a great way to understand the game and improve the enjoyment of watching the game. If you’re just getting started, here are some of the most important stats to know. As you learn more, don’t forget to come back and check out this post for explanations of even more complex stats. Enjoy!
Hello everyone. My name is Jason Butler, and I live in California, America. I was a professional AAA Minor League Baseball player. I lost my chance of playing MLB for injury issues, but I did not lose my love for baseball. I attended the coaching training program and am now working as a coach in a small school in San Diego.
I always love to share my experience and knowledge if that can help you. Play baseball, and stay fit.