Baseball is filled with abbreviations, which can make it challenging for newcomers to keep up with the game’s statistics and terminology. Whether you’re checking out player stats, watching a live game, or diving into advanced analytics, these abbreviations offer a quick and efficient way to understand the key aspects of a player’s performance and the game.
In this article, I’ll explore these abbreviations in detail, breaking them down into categories like batting, pitching, fielding, and more. Understanding these will give you a deeper appreciation of the game and help you follow it like a pro!
2. Offensive Abbreviations (Batting Statistics)
Batting is one of the most essential aspects of baseball, and there are many abbreviations to help evaluate a player’s performance at the plate. Here’s a breakdown of the most common offensive stats:
- AB (At-Bat): The number of times a player steps up to the plate and either hits, walks, or strikes out. It excludes sacrifices and walks.
- AVG (Batting Average): A player’s batting average is calculated by dividing their hits by their at-bats. This stat shows how often a player successfully gets a hit when at bat. For example, if a player’s AVG is .300, it means they get a hit 30% of the time.
- HR (Home Runs): The total number of times a player hits the ball out of the park, scoring automatically without needing to run all the bases.
- RBI (Runs Batted In): This stat measures how many runs a batter has contributed to scoring. For instance, if a player hits a single and brings a teammate home, they earn an RBI.
- OBP (On-Base Percentage): This shows how often a batter gets on base, calculated using a formula that includes hits, walks, and hit-by-pitches, divided by total plate appearances.
- SLG (Slugging Percentage): Slugging measures the power of a hitter by dividing total bases by at-bats. Doubles, triples, and home runs contribute more heavily than singles.
- OPS (On-Base Plus Slugging): This stat combines a player’s OBP and SLG to provide an overall measure of their offensive value.
3. Pitching Abbreviations

Pitching plays a critical role in determining the outcome of any baseball game. Here are some common pitching abbreviations:
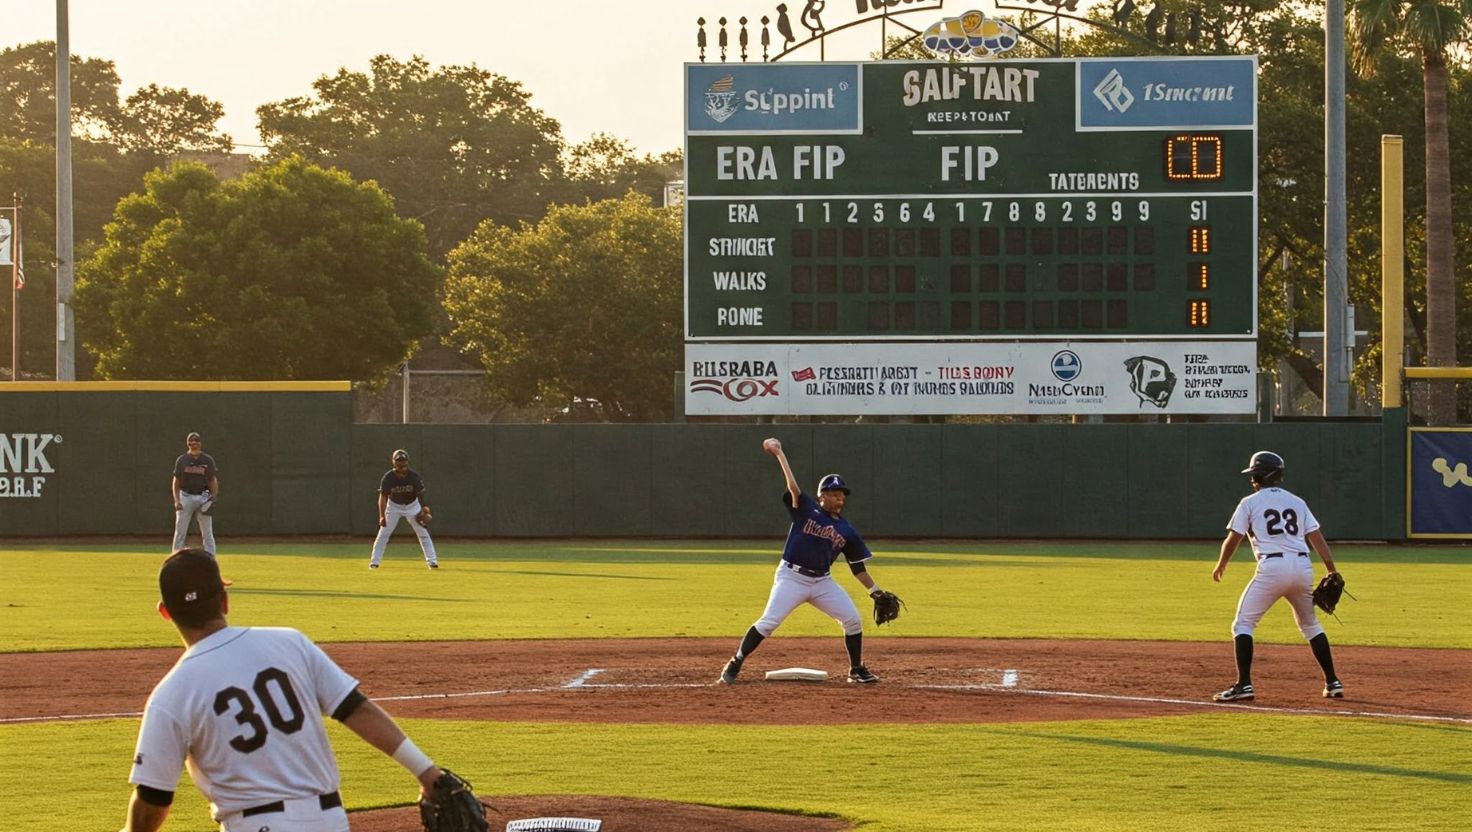
ERA (Earned Run Average)
let’s break down ERA, or Earned Run Average, in a way that’s easy to understand. Imagine you’re a pitcher, and your job is to stop the other team from scoring. ERA is basically a way to see how well you’re doing that job.
It tells you, on average, how many runs you give up per nine innings pitched. So, if you pitch nine innings and give up three earned runs, your ERA is 3.00. Simple, right?
Now, “earned runs” are the key. Those are runs that scored because of your pitching, not because of errors by your teammates. If your shortstop boots a grounder and a run scores, that doesn’t count against your ERA. It’s all about what you control.
A lower ERA is better. 1 It means you’re keeping runs off the board, which is exactly what a good pitcher does. It’s a quick way to see who’s really tough to score against.
IP (Innings Pitched)
This measures how many innings a pitcher has thrown. One inning equals three outs, and this stat tracks how much time a pitcher has spent on the mound.
W (Wins)
This shows how many games the pitcher has won as the “winning pitcher” in games where their team ended up victorious.
L (Losses)
This is the opposite of wins and tracks how many games the pitcher was on the mound during a loss for their team.
K (Strikeouts):
The total number of times the pitcher has struck out opposing batters.
WHIP (Walks and Hits per Inning Pitched): WHIP evaluates how well a pitcher keeps opposing players off base, combining the total number of walks and hits allowed divided by innings pitched.
4. Fielding Abbreviations
Defense is just as important as offense in baseball. Below are some key fielding abbreviations:
PO (Putouts)
A putout occurs when a defensive player is directly responsible for an out. This includes tagging a runner or catching a fly ball.
A (Assists)
Assists are recorded when a defensive player helps make an out. For example, if a shortstop throws the ball to first base to retire a runner, they receive an assist.
E (Errors)
An error is charged to a fielder who misplays a ball in a way that allows a runner to reach base or advance further. Errors negatively impact a fielder’s overall performance stats.
FP (Fielding Percentage)
This statistic is calculated by adding putouts and assists, then dividing that sum by total chances (putouts + assists + errors). A high fielding percentage indicates strong defensive play.
DP (Double Plays)
A double play occurs when two offensive players are put out during the same continuous play.
Base Running Abbreviations
Base running plays a crucial role in scoring runs and advancing players. Understanding these abbreviations helps to analyze how well a player performs on the basepaths:
SB (Stolen Bases)
This stat records how many times a player successfully steals a base, advancing to the next without being caught by the defense.
CS (Caught Stealing)
The number of times a player is thrown out while attempting to steal a base. A high caught stealing rate can indicate poor judgment or timing by the runner.
R (Runs)
This stat tracks how many times a player successfully makes it around the bases and scores a run for their team.
6. Team Abbreviations
Team statistics are vital for understanding how the team is performing overall.

Here are the most common abbreviations used to assess team success:
W-L (Win-Loss Record)
This shows the total number of games a team has won (W) and lost (L). For example, a record of 50-30 means the team has won 50 games and lost 30.
For a team, it tells you their overall performance for the season. A team with a 90-72 record had a pretty good year, right? For a pitcher, it shows how many games they’ve been credited with winning or losing. If a pitcher starts a game and their team wins, they might get the “win” credit. If their team loses, they might get the “loss.”
GB (Games Behind)
GB measures how far a team is behind the division leader in terms of wins and losses. If a team is 2 GB, it means they are two games behind the leader in their division.
Here’s the quick math: you take the difference in wins between the two teams and add it to the difference in losses, then divide that number by two. That’s your GB.
So, if the leading team has 50 wins and your team has 48, that’s a two-game difference. But if the leader also has 30 losses and your team has 32, that’s another two-game difference. Add those together (four) and divide by two, and you’re two games behind! It’s a handy tool to see how close the race really is.
PCT (Winning Percentage)
This stat calculates a team’s winning percentage by dividing the total number of wins by the total number of games played. For example, a team with a winning percentage of .600 has won 60% of their games.
It’s a decimal, so you’ll usually see it like .600, .450, and so on. Higher is better, of course. It’s the quickest way to compare teams and see who’s really on top. No fancy math needed, just wins and losses. It’s the classic way to see who’s having a good season.
RS (Runs Scored)
This shows the total number of runs a team has scored during the season.
RA (Runs Allowed)
RA refers to how many runs the team has allowed their opponents to score.
RD (Run Differential)
Run Differential is the difference between runs scored (RS) and runs allowed (RA). A positive RD means the team has scored more runs than they’ve allowed, which is often a strong indicator of overall team performance.
7. Advanced Statistics (Sabermetrics)
Advanced statistics, also known as sabermetrics, are used by teams, analysts, and enthusiasts to dive deeper into a player’s or team’s performance.
These stats go beyond traditional numbers, offering more insightful metrics for understanding the game:
WAR (Wins Above Replacement)
Okay, so you’ve probably heard baseball folks throw around “WAR,” right? It stands for Wins Above Replacement, and honestly, it’s just a fancy way to figure out how valuable a player is.
Imagine you’ve got your star player, and then you’ve got a “replacement-level” guy, basically, someone you could pull up from the minors or grab off the waiver wire. WAR tries to measure how many more wins your star player adds to the team compared to that replacement-level dude.
It’s not perfect, because it’s based on stats and estimations, but it gives you a good idea of who’s really making a difference. High WAR? That player’s a stud. Low WAR or even negative? Maybe not so much. It’s a way to look beyond just home runs or RBIs and see the overall impact a player has on winning games.
BABIP (Batting Average on Balls in Play)
BABIP measures how often a ball in play results in a hit, excluding home runs. It helps evaluate how lucky or unlucky a hitter or pitcher has been.
Why is it useful? Well, sometimes a player might be getting unlucky, hitting line drives that get caught. Or maybe they’re getting lucky, with weak grounders finding holes. BABIP helps us see if a player’s batting average is maybe a bit inflated or deflated by luck, giving a clearer picture of their true hitting ability.
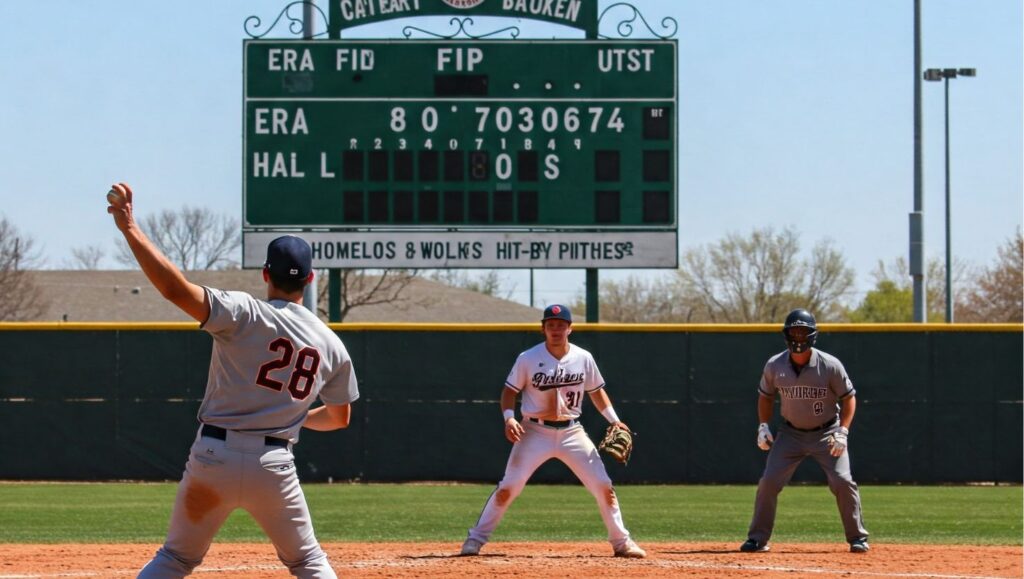
FIP (Fielding Independent Pitching)
you’ve heard about ERA, right? That’s the classic way to judge a pitcher, but it can be a bit misleading. Sometimes, a pitcher gets lucky with good defense behind them, or unlucky with bad defense. That’s where FIP, or Fielding Independent Pitching, comes in.
FIP focuses on outcomes a pitcher can control (strikeouts, walks, home runs) while removing factors like defensive errors. It’s often used to predict future pitching success.
A lower FIP means the pitcher is doing a better job of preventing runs, regardless of how good or bad the fielders are. It’s like saying, “If the defense was average, this is how many runs this pitcher would likely allow.” So, while ERA tells you what happened, FIP gives you a better idea of a pitcher’s underlying skill. Pretty neat, huh?
WOBA (Weighted On-Base Average)
This stat combines all the ways a hitter can get on base (singles, doubles, walks, etc.) but weights each based on their importance to scoring. It’s a more precise measure than OBP alone.
OPS+ (Adjusted OPS)
OPS+ adjusts a player’s OPS for the ballparks and leagues they play in, providing a better comparison between players from different teams and eras. A score of 100 is average, with anything above representing an above-average player.
ERA+ (Adjusted ERA)
ERA+ adjusts a pitcher’s ERA by considering the ballpark and league factors. Like OPS+, 100 is average, and anything above indicates a better-than-average performance.
8. Conclusion
Understanding baseball abbreviations is essential for anyone looking to enjoy the game on a deeper level. These stats provide insights into player performance, team success, and even future outcomes. Whether you’re a casual fan looking to keep up with basic stats or a die-hard follower diving into advanced sabermetrics, knowing these abbreviations can enhance your appreciation of baseball. As you follow your favorite players and teams, these abbreviations will help you track their success and understand the game’s many layers more clearly.
Hello everyone. My name is Jason Butler, and I live in California, America. I was a professional AAA Minor League Baseball player. I lost my chance of playing MLB for injury issues, but I did not lose my love for baseball. I attended the coaching training program and am now working as a coach in a small school in San Diego.
I always love to share my experience and knowledge if that can help you. Play baseball, and stay fit.